matlibplot的交互式demo
阻塞式绘图的demo
def test001():x = [1,2,3,4,5,6,7,8]x = np.array(x)y = x**3y2=x**2y3=xplt.figure(figsize=(5,5))plt.subplot(2,2,1)plt.title("start")plt.plot(x,y,label='y**3')plt.legend()plt.grid(True)plt.subplot(2,2,2)plt.plot(x,y2)plt.grid(True)plt.subplot(2,2,3)plt.plot(x,y3)plt.grid(True)plt.show()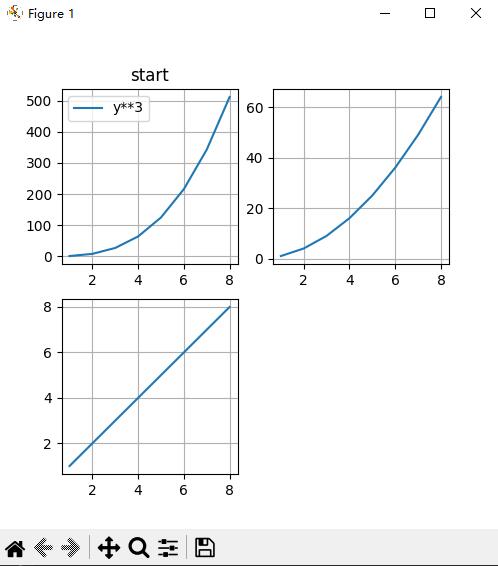
分割figure,创建子坐标系
subplot(m,n,p)将当前图窗划分为 mxn
'''
subplot(m, n, p)
m:子图的行数。
n:子图的列数。
p:当前子图的位置(按行优先顺序编号)
'''
交互式绘图:
模型训练里面需要动态绘制loss的损失情况列子:
# 训练模型num_epochs = 100losses=[]for epoch in range(num_epochs):print(epoch)for input,target in test_loader:# 前向传播outputs = model(input)loss = criterion(outputs, target)# 反向传播和优化optimizer.zero_grad() #loss.backward()optimizer.step()if (epoch+1) % 100 == 0:print(f'Epoch [{epoch+1}/{num_epochs}], Loss: {loss.item():.4f}')losses.append(loss.item())print(loss)#开始绘图plt.clf(); #清除当前图形,防止之前的绘图内容重叠,确保每次迭代都重新绘制。plt.ion() #启用交互模式(Interactive Mode),允许图表在非阻塞模式下实时更新,无需等待用户关闭窗口。plt.title("Epoch {}".format(epoch))plt.plot(losses, 'c-', linewidth=1, label='Label') #'c-' 表示青色实线,linewidth=1 设置线宽plt.draw();#立即重绘图形,结合 plt.ion() 实现实时更新。plt.pause(0.05);#短暂暂停(0.05秒),允许图形界面处理事件(如刷新),确保动态效果流畅。暂停时间过长会拖慢训练,过短可能导致卡顿。import matplotlib
matplotlib.use('TkAgg')
import matplotlib.pyplot as plt
import numpy as np
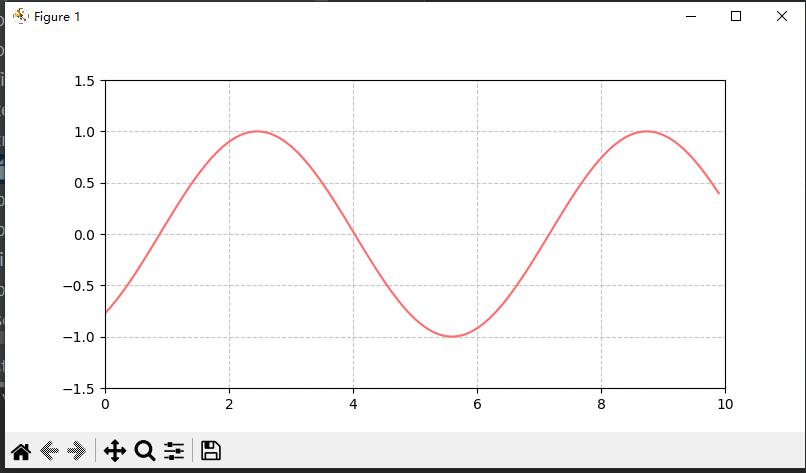
def testht03_optimized():x = np.arange(0, 10, 0.1)plt.ion()# 初始化专业绘图环境fig, ax = plt.subplots(figsize=(8, 4))ax.set_xlim(0, 10) # 锁定X轴ax.set_ylim(-1.5, 1.5) # 扩展Y轴范围防边缘裁剪ax.grid(True, linestyle='--', alpha=0.7) # 专业风格网格# 创建波形线对象line, = ax.plot(x, np.sin(x),lw=1.5,color='#FF6B6B')# 专业动画循环for i in range(2000): # 增加帧数演示流畅度# 相位偏移计算phase_shift = i * 0.15y = np.sin(x + phase_shift)# 高效数据更新line.set_ydata(y)# 专业级渲染控制fig.canvas.draw_idle() # 增量渲染fig.canvas.flush_events()# 精准帧率控制plt.pause(0.005) # 提升到200FPSplt.close() # 专业内存管理展示:
最简单的交互式:
def testht03():x = np.arange(0,10,0.1)plt.ion()for i in range(100):plt.plot(x,np.sin(x+i*0.1))plt.grid(True)plt.draw()plt.pause(0.01)plt.clf() 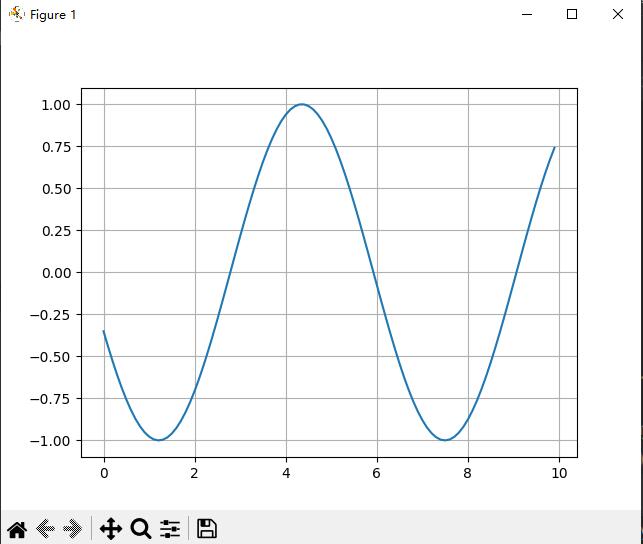
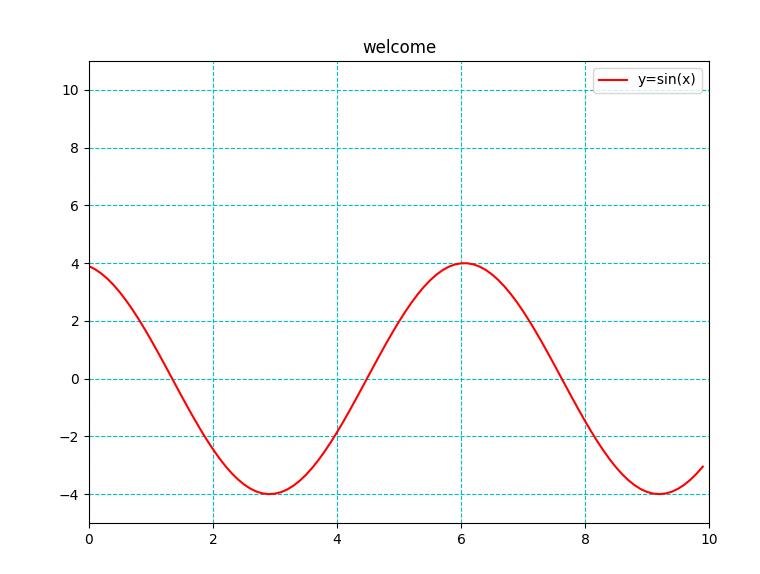
def testht06():x = np.arange(0,10,0.1)plt.ion()fig,ax = plt.subplots(figsize=(8,6))ax.set_title("welcome")ax.set_xlim(0,10)ax.set_ylim(-5,11)ax.grid(True,linestyle='--',color='c')line, = ax.plot(x,np.sin(x),color="r",label="y=sin(x)")ax.legend()for i in range(200):line.set_ydata(4*np.sin(x+0.1*i))fig.canvas.draw_idle()fig.canvas.flush_events()plt.pause(0.01)plt.close()