多线性读取数据实现QCustomPlot瀑布图
最新学习使用QCustomPlot,这里做了个简单的demo实现瀑布图
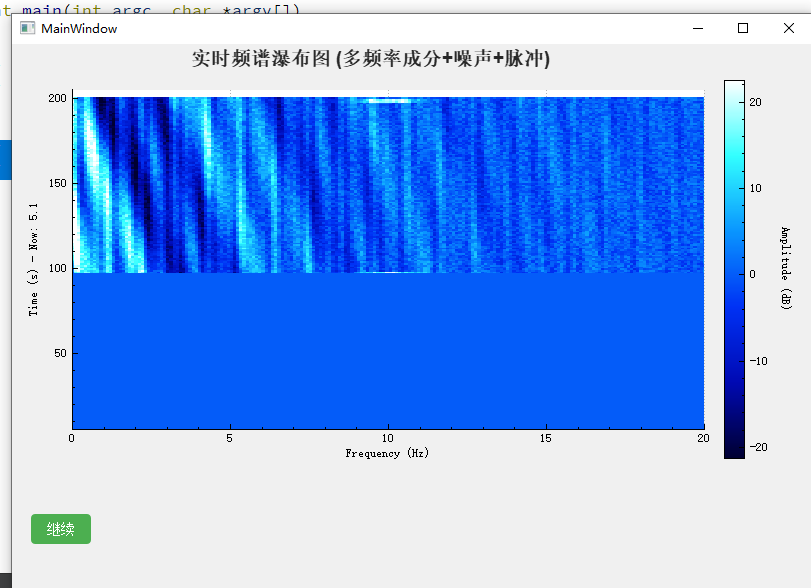
实现结果
瀑布图demo
实现过程
1.界面设计
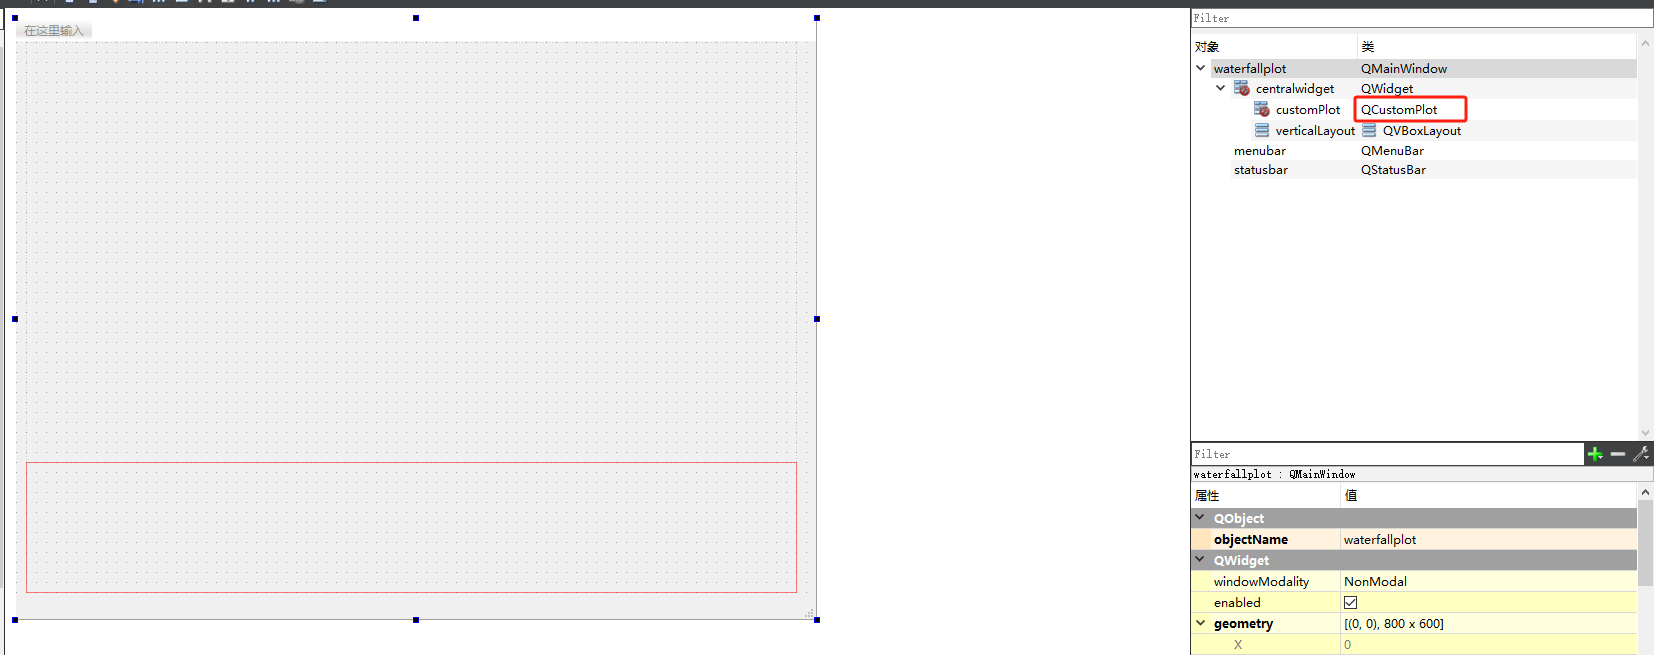
界面较简单,QtDesign里面放置了widget(需要升级为QCustomPlot)和一个verticalLayout(用于放置按钮)
代码初始化瀑布图,步骤为
a.创建颜色映射图
b.设置颜色梯度
c.设置数据范围
d.设置坐标轴
e.设置网格样式
f.设置颜色标尺
g.设置交互功能
h.设置标题及背景样式
代码如下:
void waterfallplot::setupPlot()
{// 初始化瀑布图显示// 1. 创建颜色映射图m_colorMap = new QCPColorMap(ui->customPlot->xAxis, ui->customPlot->yAxis);m_colorMap->data()->setSize(200, HISTORY_SIZE);  // 200列(频率点) x HISTORY_SIZE行(时间历史)m_colorMap->data()->setRange(QCPRange(0, 20), QCPRange(0, HISTORY_SIZE));  // x:0-20Hz, y:0-HISTORY_SIZE// 2. 设置更鲜艳的颜色梯度QCPColorGradient gradient;gradient.setColorStopAt(0.0, QColor(0, 0, 200));      // 深蓝gradient.setColorStopAt(0.2, QColor(0, 100, 255));    // 亮蓝gradient.setColorStopAt(0.4, QColor(0, 255, 255));    // 青色gradient.setColorStopAt(0.6, QColor(100, 255, 100));  // 亮绿gradient.setColorStopAt(0.8, QColor(255, 255, 0));    // 黄色gradient.setColorStopAt(1.0, QColor(255, 50, 50));    // 亮红m_colorMap->setGradient(gradient);m_colorMap->setInterpolate(false);  // 禁用颜色插值,使颜色边界更清晰// 3. 设置初始数据范围m_colorMap->setDataRange(QCPRange(-30, 30));// 4. 坐标轴设置ui->customPlot->xAxis->setLabel("Frequency (Hz)");ui->customPlot->yAxis->setLabel("Time (s)");ui->customPlot->xAxis->setRange(0, 20);  // 0-20Hzui->customPlot->yAxis->setRange(0, HISTORY_SIZE);// 设置网格线样式ui->customPlot->xAxis->grid()->setPen(QPen(QColor(180, 180, 180), 1, Qt::DotLine));ui->customPlot->yAxis->grid()->setPen(QPen(QColor(180, 180, 180), 1, Qt::DotLine));// 5. 添加颜色标尺QCPColorScale *colorScale = new QCPColorScale(ui->customPlot);ui->customPlot->plotLayout()->addElement(0, 1, colorScale);  // 添加到右侧colorScale->setType(QCPAxis::atRight);m_colorMap->setColorScale(colorScale);colorScale->axis()->setLabel("Amplitude (dB)");colorScale->axis()->setTickLabels(true);// 6. 设置交互功能ui->customPlot->setInteractions(QCP::iRangeDrag | QCP::iRangeZoom | QCP::iSelectPlottables);// 7. 添加标题ui->customPlot->plotLayout()->insertRow(0);  // 在上方添加一行QCPTextElement *title = new QCPTextElement(ui->customPlot,"实时频谱瀑布图 (多频率成分+噪声+脉冲)", QFont("Arial", 14, QFont::Bold));title->setTextColor(QColor(40, 40, 40));  // 深灰色标题ui->customPlot->plotLayout()->addElement(0, 0, title);// 8. 设置背景样式ui->customPlot->setBackground(QBrush(QColor(240, 240, 240)));  // 浅灰色背景ui->customPlot->axisRect()->setBackground(QBrush(Qt::white));  // 白色绘图区
}
初始化按钮ui,代码如下
void waterfallplot::setupControls()
{// 设置控制UI// 1. 创建暂停/继续按钮QPushButton *pauseButton = new QPushButton("暂停", this);pauseButton->setStyleSheet("QPushButton {""  background-color: #4CAF50;"  // 绿色背景"  border: none;""  color: white;""  padding: 8px 16px;""  font-size: 14px;""  border-radius: 4px;""}""QPushButton:hover {""  background-color: #45a049;"  // 深绿色悬停效果"}");// 连接按钮点击信号connect(pauseButton, &QPushButton::clicked, this, &waterfallplot::onPauseClicked);// 2. 创建布局QHBoxLayout *layout = new QHBoxLayout();layout->addWidget(pauseButton);layout->addStretch();  // 添加伸缩项使按钮靠左// 3. 创建容器控件QWidget *controls = new QWidget(this);controls->setLayout(layout);controls->setStyleSheet("background-color: #f0f0f0;");  // 浅灰色背景// 4. 添加到主布局ui->verticalLayout->addWidget(controls);
}
2.多线程生成数据
为了实现实时效果且不影响ui显示,才去多线程的方法根据当前事件生成模拟数据,使用emit将数据发送出去
主要代码如下:
void DataGenerator::run()
{// 线程主函数qDebug() << "数据生成线程启动 - 线程ID:" << QThread::currentThreadId();QElapsedTimer timer;           // 用于计算帧率timer.start();int frameCount = 0;while (m_running)              // 主循环{// 检查暂停状态{QMutexLocker locker(&m_mutex);if (m_paused){QThread::msleep(100);  // 暂停时休眠100mscontinue;}}// 生成数据并发送信号QVector<double> data = generateSignalData();emit newDataGenerated(data);  // 发射信号到主线程// 计算并显示帧率frameCount++;if (timer.elapsed() >= 1000){qDebug() << "数据生成帧率:" << frameCount << "FPS";frameCount = 0;timer.restart();}// 按间隔休眠,控制数据生成频率QThread::msleep(m_updateInterval);}qDebug() << "数据生成线程结束";
}
3.根据数据更新UI实现瀑布效果
读取数据,然后重新绘制瀑布图,更新y轴显示,实现瀑布效果
代码如下:
void waterfallplot::updatePlot(const QVector<double> &newData)
{// 更新瀑布图显示qDebug() << "接收到新数据,数据大小:" << newData.size();if(newData.isEmpty()) {qWarning() << "接收到空数据!";return;}// 1. 数据滚动:将旧数据向上移动一行for (int y = 1; y < HISTORY_SIZE; ++y){for (int x = 0; x < newData.size(); ++x){m_colorMap->data()->setCell(x, y-1, m_colorMap->data()->cell(x, y));}}// 2. 在最后一行添加新数据for (int x = 0; x < newData.size(); ++x) {m_colorMap->data()->setCell(x, HISTORY_SIZE-1, newData[x]);}// 3. 计算数据范围auto [minIt, maxIt] = std::minmax_element(newData.constBegin(), newData.constEnd());double minValue = *minIt;double maxValue = *maxIt;// 调试输出qDebug() << QString("更新瀑布图[%1] - 范围: %2~%3 - 最新数据: %4...%5").arg(m_dataIndex).arg(minValue, 0, 'f', 2).arg(maxValue, 0, 'f', 2).arg(newData.first(), 0, 'f', 2).arg(newData.last(), 0, 'f', 2);m_dataIndex++;// 4. 动态调整颜色映射范围static QCPRange dataRange(-30, 30);  // 初始范围// 平滑调整范围,避免突变dataRange.lower = qMin(dataRange.lower * 0.9, minValue * 0.9);dataRange.upper = qMax(dataRange.upper * 0.9, maxValue * 1.1);m_colorMap->setDataRange(dataRange);// 5. 更新时间轴显示static double timeOffset = 0;timeOffset += 0.05;  // 每次更新增加0.05单位时间ui->customPlot->yAxis->setRange(timeOffset, HISTORY_SIZE + timeOffset);ui->customPlot->yAxis->setLabel(QString("Time (s) - Now: %1").arg(timeOffset, 0, 'f', 1));// 6. 请求重绘(使用队列重绘优化性能)ui->customPlot->replot(QCustomPlot::rpQueuedReplot);
}
希望对大家有所帮助.