VUE3+Mapbox-GL 实现鼠标绘制矩形功能的详细代码和讲解
以下是如何使用 Mapbox GL JS 实现鼠标绘制矩形功能的详细代码和讲解。Mapbox GL JS 是一个强大的 JavaScript 库,可以用来创建交互式地图。下面将通过监听鼠标事件并动态更新地图图层来实现这一功能。
实现步骤
-
初始化地图
- 在 HTML 文件中引入 Mapbox GL JS 库,并设置一个容器来显示地图。
- 创建一个
mapboxgl.Map实例,配置地图样式、中心点和缩放级别。
-
监听鼠标事件
- 使用
map.on方法监听mousedown(鼠标按下)、mousemove(鼠标移动)和mouseup(鼠标松开)事件。 - 在
mousedown时记录矩形的起始点。 - 在
mousemove时根据鼠标位置实时更新矩形。 - 在
mouseup时结束绘制并固定矩形。
- 使用
-
绘制矩形
- 使用 GeoJSON 数据格式表示矩形。
- 通过
map.addSource和map.addLayer将矩形添加到地图上。 - 在鼠标移动时动态更新 GeoJSON 数据以显示矩形的当前形状。
-
结束绘制
- 在绘制完成后移除不必要的事件监听器,避免重复触发。
详细代码
以下是完整的 HTML 和 JavaScript 代码示例:
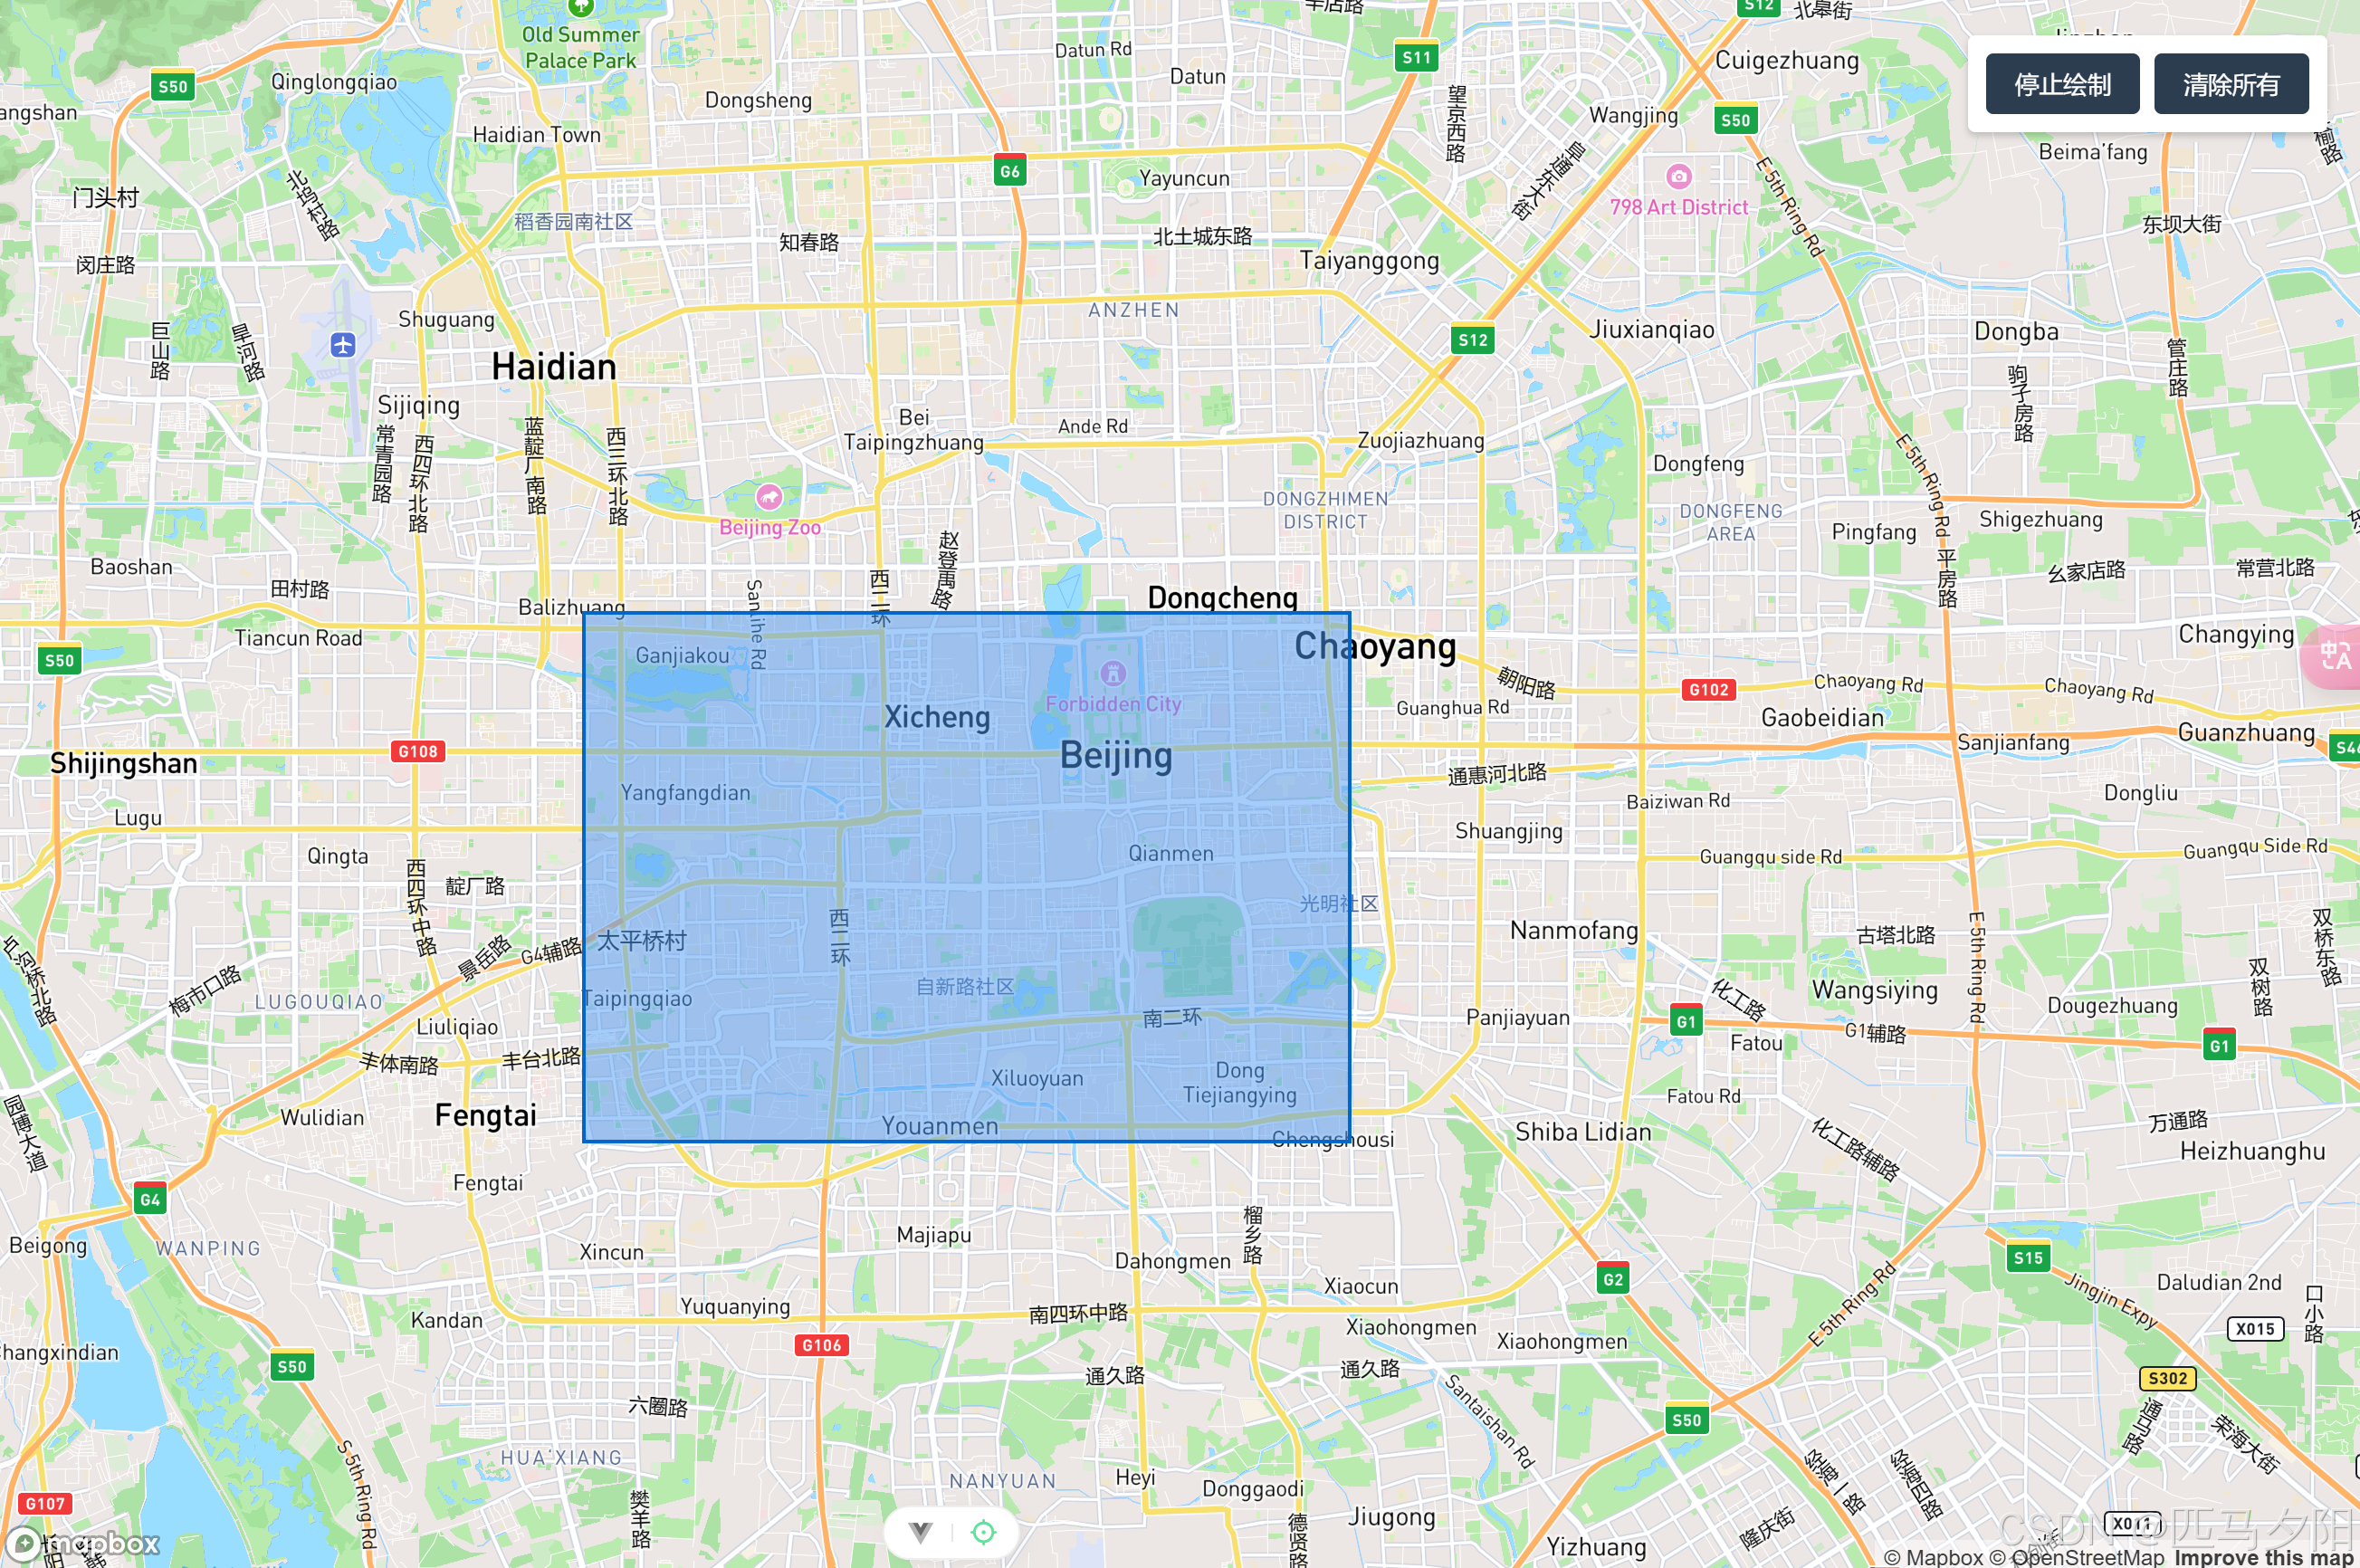
<<template><div class="map-container"><div id="map" ref="mapContainer"></div><div class="control-panel"><button @click="toggleDrawMode">{{ isDrawMode ? '停止绘制' : '开始绘制' }}</button><button @click="clearRectangles">清除所有</button></div></div>
</template><script setup lang="ts">
import { ref, onMounted, onUnmounted } from 'vue'
import mapboxgl from 'mapbox-gl'
import 'mapbox-gl/dist/mapbox-gl.css'
import { setMapInstance } from '@/utils/mapUtils'const mapContainer = ref<HTMLElement | null>(null)
let map: mapboxgl.Map | null = null
const isDrawMode = ref(false)
const isDrawing = ref(false)
const startPoint = ref<[number, number] | null>(null)
const currentRectangle = ref<GeoJSON.Feature | null>(null)
const rectangleCollection = ref<GeoJSON.FeatureCollection>({type: 'FeatureCollection',features: []
})
const rectangleLayerId = 'rectangle-layer'
const tempRectangleSourceId = 'temp-rectangle-source'
const tempRectangleLayerId = 'temp-rectangle-layer'const initMap = () => {if (!mapContainer.value) returnmapboxgl.accessToken = "你的token"map = new mapboxgl.Map({container: mapContainer.value,style: 'mapbox://styles/mapbox/streets-v12',center: [116.397428, 39.90923],zoom: 12})map.on('load', () => {// Add source for completed rectanglesmap?.addSource('rectangle-source', {type: 'geojson',data: rectangleCollection.value})// Add layer for completed rectanglesmap?.addLayer({id: rectangleLayerId,type: 'fill',source: 'rectangle-source',paint: {'fill-color': '#4e9af5','fill-opacity': 0.5,'fill-outline-color': '#0066cc'}})// Add layer for rectangle outlinemap?.addLayer({id: 'rectangle-outline',type: 'line',source: 'rectangle-source',paint: {'line-color': '#0066cc','line-width': 2}})// Add source for the temp rectangle being drawnmap?.addSource(tempRectangleSourceId, {type: 'geojson',data: {type: 'Feature',geometry: {type: 'Polygon',coordinates: [[[0, 0],[0, 0],[0, 0],[0, 0],[0, 0]]]},properties: {}}})// Add layer for the temp rectanglemap?.addLayer({id: tempRectangleLayerId,type: 'fill',source: tempRectangleSourceId,paint: {'fill-color': '#4e9af5','fill-opacity': 0.3,'fill-outline-color': '#0066cc'}})// Add temp rectangle outline layermap?.addLayer({id: 'temp-rectangle-outline',type: 'line',source: tempRectangleSourceId,paint: {'line-color': '#0066cc','line-width': 2,'line-dasharray': [2, 2]}})// Event handlers for drawingsetupDrawingEventHandlers()})setMapInstance(map)
}const setupDrawingEventHandlers = () => {if (!map) return// First click - start drawingmap.on('click', (e) => {if (!isDrawMode.value) return// If not drawing yet, start a new rectangleif (!isDrawing.value) {isDrawing.value = truestartPoint.value = [e.lngLat.lng, e.lngLat.lat]// Initialize the temp rectangleupdateTempRectangle(startPoint.value, startPoint.value)} // If already drawing, complete the rectangleelse if (startPoint.value) {const endPoint: [number, number] = [e.lngLat.lng, e.lngLat.lat]// Complete the rectanglecompleteRectangle(startPoint.value, endPoint)// Reset drawing stateisDrawing.value = falsestartPoint.value = null// Clear temp rectangleupdateTempRectangle([0, 0], [0, 0])}})// Mouse move - update rectangle while in drawing mode, but after first clickmap.on('mousemove', (e) => {// Only update if we're in drawing mode AND we've made the first clickif (!isDrawMode.value || !isDrawing.value || !startPoint.value) return// Update the rectangle as mouse moves (without needing to hold the button)updateTempRectangle(startPoint.value, [e.lngLat.lng, e.lngLat.lat])})
}const updateTempRectangle = (start: [number, number], end: [number, number]) => {if (!map) return// Create rectangle coordinates from start and end pointsconst coords = createRectangleCoordinates(start, end)// Update the temporary rectangleconst geojsonSource = map.getSource(tempRectangleSourceId) as mapboxgl.GeoJSONSourceif (geojsonSource) {geojsonSource.setData({type: 'Feature',geometry: {type: 'Polygon',coordinates: [coords]},properties: {}})}
}const completeRectangle = (start: [number, number], end: [number, number]) => {if (!map) return// Create rectangle coordinates from start and end pointsconst coords = createRectangleCoordinates(start, end)// Skip if rectangle is too smallif (Math.abs(start[0] - end[0]) < 0.0001 && Math.abs(start[1] - end[1]) < 0.0001) {return}// Create a new rectangle featureconst newRectangle: GeoJSON.Feature = {type: 'Feature',geometry: {type: 'Polygon',coordinates: [coords]},properties: {id: Date.now().toString()}}// Add to collectionrectangleCollection.value.features.push(newRectangle)// Update the map sourceconst source = map.getSource('rectangle-source') as mapboxgl.GeoJSONSourceif (source) {source.setData(rectangleCollection.value)}
}const createRectangleCoordinates = (start: [number, number], end: [number, number]): [number, number][] => {return [[start[0], start[1]],[end[0], start[1]],[end[0], end[1]],[start[0], end[1]],[start[0], start[1]] // Close the polygon]
}const toggleDrawMode = () => {isDrawMode.value = !isDrawMode.valueif (!isDrawMode.value) {// Reset drawing state when exiting draw modeisDrawing.value = falsestartPoint.value = nullupdateTempRectangle([0, 0], [0, 0])}// Change cursor based on draw modeif (map) {map.getCanvas().style.cursor = isDrawMode.value ? 'crosshair' : ''}
}const clearRectangles = () => {if (!map) return// Clear all rectanglesrectangleCollection.value.features = []// Update the map sourceconst source = map.getSource('rectangle-source') as mapboxgl.GeoJSONSourceif (source) {source.setData(rectangleCollection.value)}
}onMounted(() => {initMap()
})onUnmounted(() => {map?.remove()map = null
})
</script><style scoped>
.map-container {width: 100%;height: 100vh;position: relative;
}#map {width: 100%;height: 100%;
}.control-panel {position: absolute;top: 20px;right: 20px;z-index: 1;background: white;padding: 10px;border-radius: 4px;box-shadow: 0 2px 4px rgba(0,0,0,0.2);display: flex;gap: 8px;
}button {padding: 8px 16px;background: #2c3e50;color: white;border: none;border-radius: 4px;cursor: pointer;
}button:hover {background: #34495e;
}
</style>
代码讲解
1. 初始化地图
- 引入 Mapbox GL JS:通过
<script>和<link>标签引入 Mapbox GL JS 的 JavaScript 和 CSS 文件。 - 设置访问令牌:将
mapboxgl.accessToken设置为你的 Mapbox 访问令牌(需自行申请)。 - 创建地图实例:使用
mapboxgl.Map配置地图,指定容器 ID(map)、地图样式(streets-v11)、中心点和缩放级别。
2. 监听鼠标事件
- 鼠标点击 (
clik):- 通过
e.lngLat获取鼠标按下时的经纬度,存储在startPoint中。 - 绑定
mousemove,开始绘制流程。
- 通过
- 鼠标移动 (
mousemove):- 调用
drawRectangle函数,实时更新矩形形状。
- 调用
- 鼠标再次点击 (
clik):- 调用
stopDrawing函数,移除事件监听器,结束绘制。
- 调用
3. 绘制矩形
- 计算坐标:根据
startPoint和当前鼠标位置endPoint,生成矩形的四个顶点坐标,形成闭合的多边形。 - 创建 GeoJSON:将坐标封装为 GeoJSON 格式的
Polygon类型。 - 更新地图:
- 如果地图上已有
rectangle数据源,则通过setData更新数据。 - 如果没有,则通过
addSource添加数据源,并通过addLayer创建一个填充图层来显示矩形。
- 如果地图上已有
- 样式设置:矩形填充颜色为
#088(青色),透明度为0.5。
4. 结束绘制
- 在
stopDrawing函数中,使用map.off移除mousemove和mouseup的事件监听器,确保绘制过程不会重复触发。 - 你可以选择在此处保存矩形数据(例如存储到数组中)或添加其他功能。
注意事项
- 访问令牌:确保将
'YOUR_MAPBOX_ACCESS_TOKEN'替换为你的实际 Mapbox 访问令牌,否则地图无法加载。 - 单一矩形:当前代码只支持绘制一个矩形,绘制完成后会覆盖之前的矩形。如需支持多个矩形,可以为每个矩形生成唯一的 ID 并创建独立图层。
- 扩展功能:你可以添加按钮或逻辑来重置地图状态,或允许用户删除已绘制的矩形。
通过以上代码可以在 Mapbox GL JS 地图上实现鼠标绘制矩形的功能。这一功能适用于区域选择、地图标注等场景,具有很强的实用性。