用于体积医学图像分割的跨视角差异依赖网络|文献速递--基于多模态-半监督深度学习的病理学诊断与病灶分割
Title
题目
Cross-view discrepancy-dependency network for volumetric medical image segmentation
用于体积医学图像分割的跨视角差异依赖网络
01
文献速递介绍
医学图像分割的目标是通过为每个像素分配语义类别,从原始图像中描绘出受试者的解剖结构(例如,器官和肿瘤),这在许多临床应用中起着至关重要的作用,例如器官建模、疾病诊断和治疗规划(Shamshad et al., 2023)。对于三维图像,临床医生需要逐层手动描绘感兴趣体积(VOI),这需要大量的劳动和专业知识(Qureshi et al., 2023)。计算机辅助诊断(CAD)系统的目标是帮助临床医生迅速描绘VOI(Shi et al., 2022)。然而,这一工作在稳健性和准确性方面仍面临挑战。为了满足CAD系统需求的快速增长,开发稳健且准确的三维医学图像分割算法变得愈加迫切。
在过去十年中,深度卷积神经网络(DCNNs)引起了越来越多的关注,并推动了三维医学图像分割的发展(Xu et al., 2023;Liu et al., 2023)。通常,构建稳健的DCNNs需要大量的数据。但在许多实际场景中,这些模型经常面临数据稀缺的挑战,主要由于某些疾病的低发病率或获取大规模三维医学图像数据集的高成本(Huang et al., 2023;Jiao et al., 2023)。为了解决这一问题,许多方法尝试通过基于块的策略处理三维图像(Çiçek et al., 2016;Milletari et al., 2016;Isensee et al., 2021)。尽管这种策略能够捕捉局部空间信息,但有限的接受域使得提取长距离上下文信息变得困难。另一方面,一些研究提出利用来自三维图像的多个连续切片来训练网络(Alom et al., 2018;McHugh et al., 2021)。这些方法将切片图像视为独立样本,仅使用单视角切片图像(即轴向平面),这不可避免地忽略了来自其他两个视角(即冠状面和矢状面)的空间信息以及切片间的连续性(Dong et al., 2022)。因此,更可取的方法是基于多视角切片图像开发分割模型,从而通过同时考虑多个正交平面来保留全面的空间信息。
为此,许多多视角学习方法已应用于三维医学图像分割(Peiris et al., 2023;Lahoti et al., 2021;Ding et al., 2021;Yang et al., 2022)。在这些方法中,一种简单的方法是沿正交平面将体积分割为多视角切片图像。然后将这些切片单独输入到视角特定的分割网络中,随后融合多视角的分割结果。然而,此类方法通常涉及构建多个并行网络。因此,一些研究(Li et al., 2021;Gou et al., 2022;Mei et al., 2021)尝试使用统一网络通过一组不对称卷积核同时提取多视角表示。尽管展示了良好的性能,这些方法却忽视了切片间的空间连续性。为此,最近的研究尝试采用新视角充分利用多视角学习和基于块的策略的优点,通过将多视角信息以串行(Xia et al., 2018;Wei et al., 2019;Calisto和Lai Yuen, 2020;Zhang et al., 2022;Mlynarski et al., 2019)或并行方式(Zhou et al., 2019;Luo et al., 2020;Yang et al., 2022;Dong et al., 2022)纳入基于块的模型,以增强体积表示学习。然而,许多研究集中在结果级组合上,往往忽视了不同视角之间的差异和依赖,从而限制了多视角先验的全部潜力。
在本研究中,我们提出了一种新颖的框架,利用多视角切片先验进行体积医学图像分割。具体而言,我们的方法通过多视角切片先验辅助强化体积表示学习。我们的模型引入视角差异,以学习视角特定的表示,并在整合切片的先验知识后探索视角依赖,以聚合多视角信息。总之,本研究的主要贡献包括:(1)我们提出了一种跨视角差异依赖网络(CvDd-Net),用于体积医学图像分割。该模型能够有效利用多视角切片先验,辅助体积表示学习并提升性能。(2)我们设计了一个差异感知形态增强(DaMR)模块,以通过增强的形态信息(即对象的边界和位置)学习视角特定的表示。(3)为有效利用多视角切片先验,设计了一个依赖感知信息聚合(DaIA)模块,以增强体积的个体视角表示,并基于跨视角依赖整合增强特征。(4)我们在四个公共数据集(即甲状腺、宫颈、胰腺和胶质瘤)上进行了广泛实验,实验结果表明我们提出的模型在完全监督和半监督任务中均优于其他最新方法。
本文的其余部分安排如下。在第二节中,我们简要回顾相关工作。在第三节中详细介绍我们的具体方法。第四节呈现实验设置和结果。第五节和第六节分别给出讨论和结论。
Abatract
摘要
The limited data poses a crucial challenge for deep learning-based volumetric medical image segmentation, andmany methods have tried to represent the volume by its subvolumes (i.e., multi-view slices) for alleviating thisissue. However, such methods generally sacrifice inter-slice spatial continuity. Currently, a promising avenueinvolves incorporating multi-view information into the network to enhance volume representation learning, butmost existing studies tend to overlook the discrepancy and dependency across different views, ultimately limiting the potential of multi-view representations. To this end, we propose a cross-view discrepancy-dependencynetwork (CvDd-Net) to task with volumetric medical image segmentation, which exploits multi-view slice priorto assist volume representation learning and explore view discrepancy and view dependency for performanceimprovement. Specifically, we develop a discrepancy-aware morphology reinforcement (DaMR) module toeffectively learn view-specific representation by mining morphological information (i.e., boundary and positionof object). Besides, we design a dependency-aware information aggregation (DaIA) module to adequatelyharness the multi-view slice prior, enhancing individual view representations of the volume and integratingthem based on cross-view dependency. Extensive experiments on four medical image datasets (i.e., Thyroid,Cervix, Pancreas, and Glioma) demonstrate the efficacy of the proposed method on both fully-supervised andsemi-supervised tasks.
有限的数据对基于深度学习的体积医学图像分割提出了关键挑战,许多方法尝试通过其子体积(即多视角切片)来表示体积,以缓解这一问题。然而,此类方法通常牺牲了切片间的空间连续性。目前,一个有前景的方向是将多视角信息纳入网络中,以增强体积表示学习,但大多数现有研究往往忽视了不同视角之间的差异和依赖关系,最终限制了多视角表示的潜力。为此,我们提出了一种跨视角差异依赖网络(CvDd-Net),用于体积医学图像分割,该网络利用多视角切片先验来辅助体积表示学习,并探索视角差异和视角依赖以提升性能。具体而言,我们开发了一个差异感知形态增强(DaMR)模块,以有效学习视角特定的表示,通过挖掘形态信息(即对象的边界和位置)。此外,我们设计了一个依赖感知信息聚合(DaIA)模块,以充分利用多视角切片先验,增强体积的个体视角表示,并基于跨视角依赖进行整合。在四个医学图像数据集(即甲状腺、宫颈、胰腺和胶质瘤)上进行的广泛实验证明了该方法在完全监督和半监督任务上的有效性。
Method
方法
In this section, we provide the details of our method, includingmulti-view slice representation learning and network architecture. Forclearer clarity and easier understanding, we provide a table of notationsto summary all symbols and their corresponding descriptions, as shownin Table 1.
在本节中,我们提供了我们方法的详细信息,包括多视角切片表示学习和网络架构。为了更清晰和易于理解,我们提供了一个符号表,总结了所有符号及其对应的描述,如表1所示。
Conclusion
结论
Fig. 11. Complexity analysis of different models on four datasets. The horizontal and vertical axis represent the number of model’s parameters and Dice similarity coefficient, and the size of circle represents the FLOPs of model.
图11. 四个数据集上不同模型的复杂性分析。横轴和纵轴分别表示模型参数的数量和Dice相似系数,圆圈的大小表示模型的浮点运算次数(FLOPs)。
Figure
图
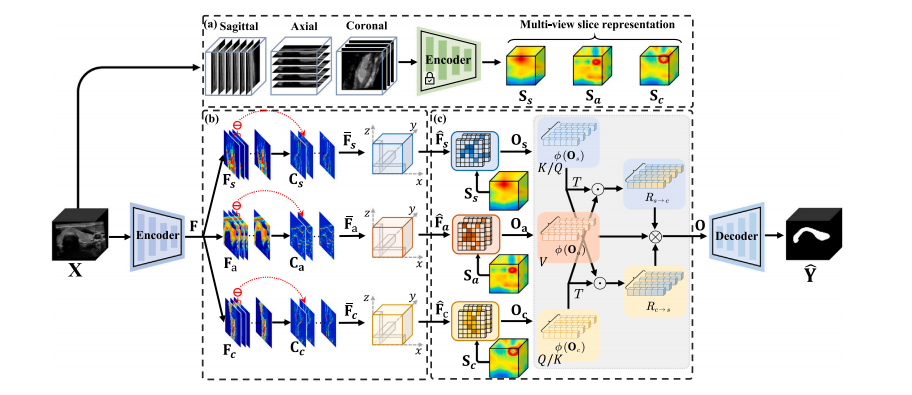
Fig. 1. The flowchart of CvDd-Net. It consists of an encoder and a decoder (color in blue) for feature extraction and prediction map generation. Besides, it also comprises: (a) aslice-based encoder (color in green) for multi-view slice representation learning, (b) a discrepancy-aware morphology reinforcement (DaMR) module for view-specific representationlearning, and (c) a dependency-aware information aggregation (DaIA) module for multi-view representation fusion.
图1. CvDd-Net的流程图。它由一个编码器和一个解码器(蓝色部分)组成,用于特征提取和预测图生成。此外,它还包括:(a)用于多视角切片表示学习的切片编码器(绿色部分),(b)用于视角特定表示学习的差异感知形态增强(DaMR)模块,以及(c)用于多视角表示融合的依赖感知信息聚合(DaIA)模块。
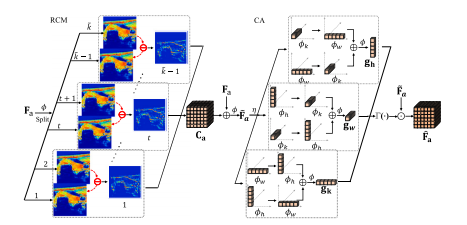
Fig. 2. Illustration of discrepancy-aware morphology reinforcement module. RCM:residual context mapping; CA: coordinate attention.
图2. 差异感知形态增强模块的示意图。RCM:残差上下文映射;CA:坐标注意力。
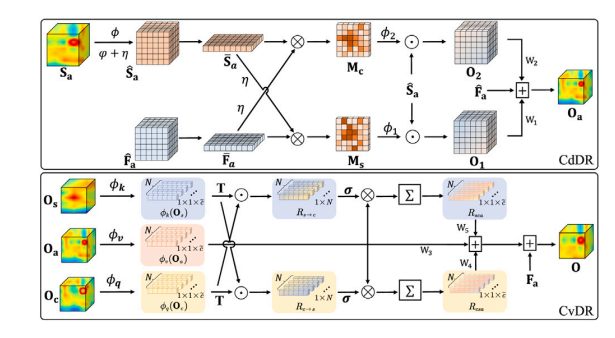
Fig. 3. Illustration of dependency-aware information aggregation module. CdDR:cross-dimension dependency-aware relation; CvDR: cross-view dependency-awarerelation.
图3. 依赖感知信息聚合模块的示意图。CdDR:跨维度依赖感知关系;CvDR:跨视角依赖感知关系。
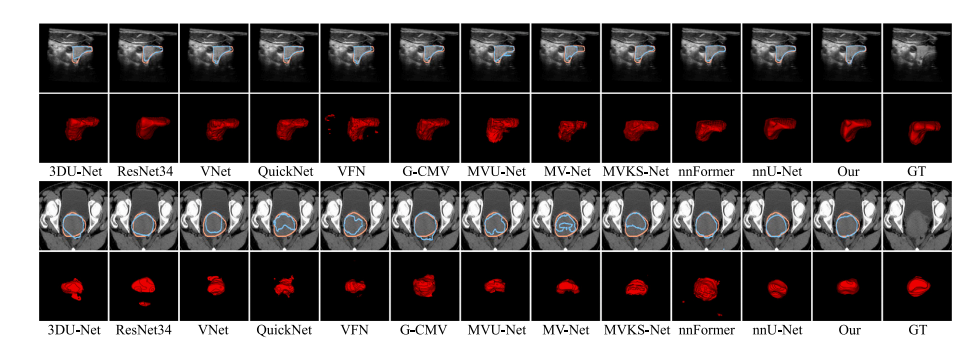
Fig. 4. Visualization results of all competing methods on some representative cases from Thyroid (top) and Cervix (bottom) datasets. The blue and orange lines in the first andthird rows represent the boundary of prediction map and ground-truth. The final column named as GT denotes the original image and its ground-truth.
图4. 来自甲状腺(顶部)和宫颈(底部)数据集中一些代表性案例的所有竞争方法的可视化结果。第一行和第三行中的蓝色和橙色线条分别表示预测图和真实标注的边界。最后一列标记为GT,表示原始图像及其真实标注。
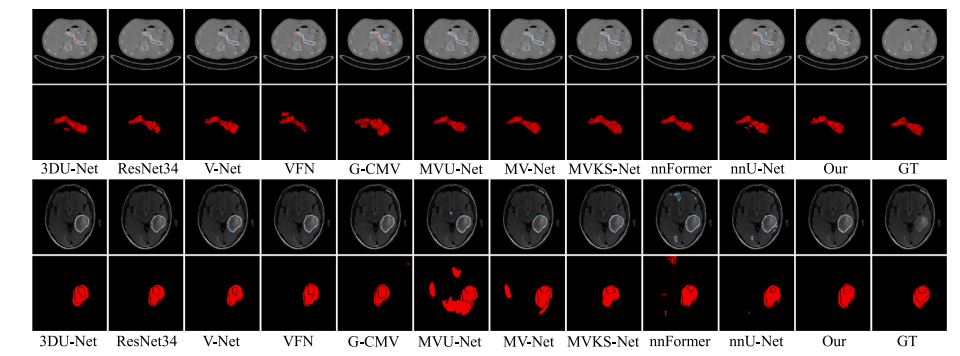
Fig. 5. Visualization results of all competing methods on some representative cases from Pancreas (top) and Glioma (bottom) datasets. The blue and orange lines in the first and third rows represent the boundary of prediction map and ground-truth. The final column named as GT denotes the original image and its ground-truth.
图5. 来自胰腺(顶部)和胶质瘤(底部)数据集中一些代表性案例的所有竞争方法的可视化结果。第一行和第三行中的蓝色和橙色线条分别表示预测图和真实标注的边界。最后一列标记为GT,表示原始图像及其真实标注。
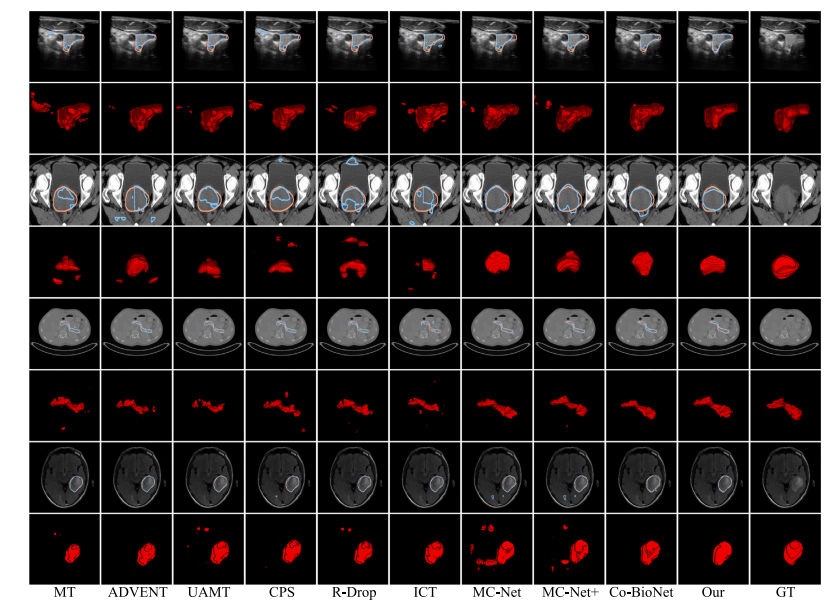
Fig. 6. Qualitative comparison of all semi-supervised methods on some representative cases from Thyroid, Cervix, Pancreas, and Glioma (from top to bottom) datasets. Thesegmentation results are from the models trained with 50% data. The blue and orange lines represent the boundary of predication and ground-truth. The final column named asGT denotes the original image and its ground-truth.
图6. 在甲状腺、宫颈、胰腺和胶质瘤(从上到下)数据集上的所有半监督方法的定性比较。分割结果来自使用50%数据训练的模型。蓝色和橙色线分别表示预测边界和真实标签。最后一列命名为GT,表示原始图像及其真实标签。
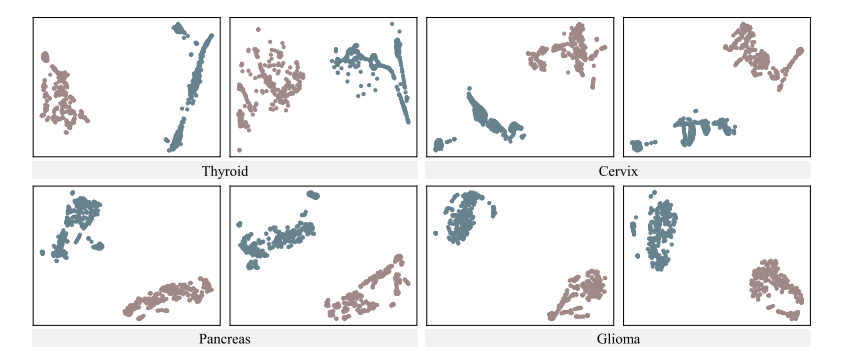
Fig. 7. Visualization of t-SNE from four datasets for validating the representation learning intuition of CvDd-Net.
图7. 四个数据集的t-SNE可视化,用于验证CvDd-Net的表示学习直觉。
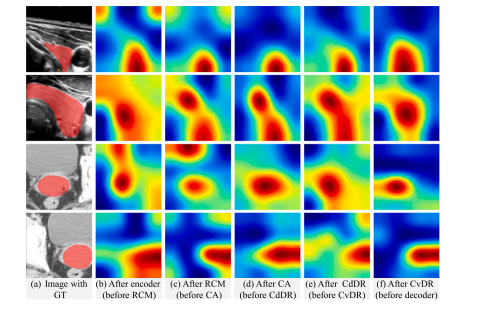
Fig. 8. Visualization of feature maps from intermediate layer of CvDd-Net. From leftto right are (a) original image with GT, feature maps (b) after encoder (before RCM),(c) after RCM (before CA), (d) after CA (before CdDR), (e) after CdDR (before CvDR),and (f) after CvDR (before decoder), respectively.
图8. CvDd-Net中间层特征图的可视化。从左到右分别为 (a) 带有真实标签的原始图像,特征图 (b) 编码器后(在RCM之前),(c) RCM后(在CA之前),(d) CA后(在CdDR之前),(e) CdDR后(在CvDR之前),以及 (f) CvDR后(在解码器之前)。
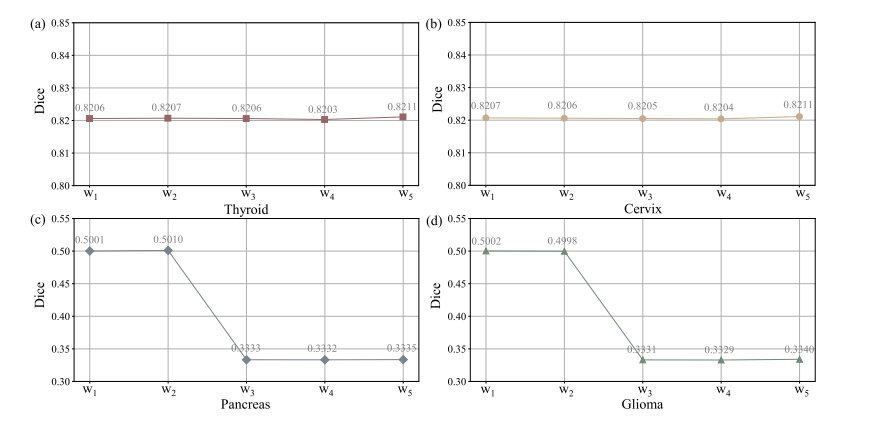
Fig. 9. Qualitative results of adaptive weights (w1 and w2 in CdDR, and w3 , w4 , and w5 in CvDR) on different datasets.
图9. 在不同数据集上自适应权重(CdDR中的w1和w2,以及CvDR中的w3、w4和w5)的定性结果。
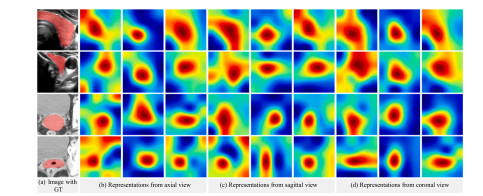
Fig. 10. Visualization of feature maps from intermediate layer of CvDd-Net that trainedwith 25% data. From left to right are (a) Image with GT, Representations from (b) axialview, (c) sagittal view, and (d) coronal view, respectively. Specifically, features shownthree columns from different views (from left to right) are: (1) slice representation, (2)feature map after CA (before CdDR), and (3) feature map after CdDR (before CvDR),respectively.
图10. 使用25%数据训练的CvDd-Net中间层特征图的可视化。从左到右分别为 (a) 带有真实标签的图像, (b) 轴向视图的表示, (c) 矢状视图,和 (d) 冠状视图。具体而言,三个列中显示的特征(从左到右)为:(1) 切片表示,(2) CA后(在CdDR之前)的特征图,以及 (3) CdDR后(在CvDR之前)的特征图。
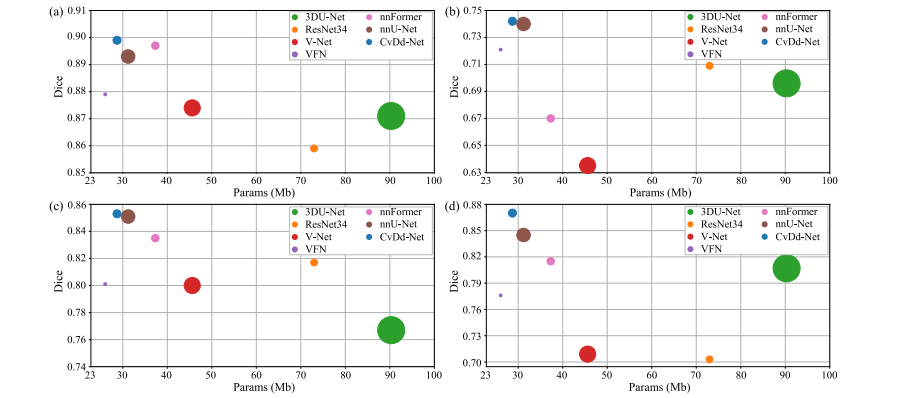
Fig. 11. Complexity analysis of different models on four datasets. The horizontal and vertical axis represent the number of model’s parameters and Dice similarity coefficient, and the size of circle represents the FLOPs of model.
图11. 四个数据集上不同模型的复杂性分析。横轴和纵轴分别表示模型参数的数量和Dice相似系数,圆圈的大小表示模型的浮点运算次数(FLOPs)。
Table
表
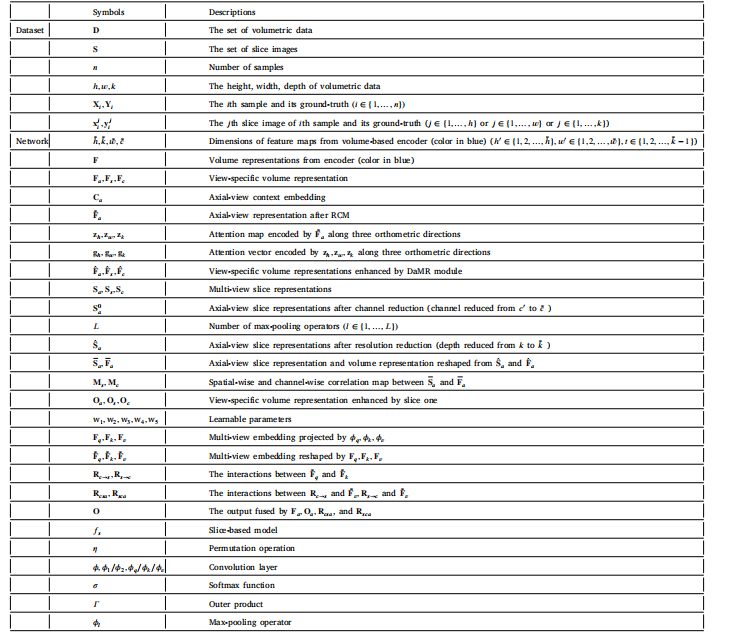
Table 1The list of symbols and their corresponding descriptions.
表1 符号列表及其对应描述。
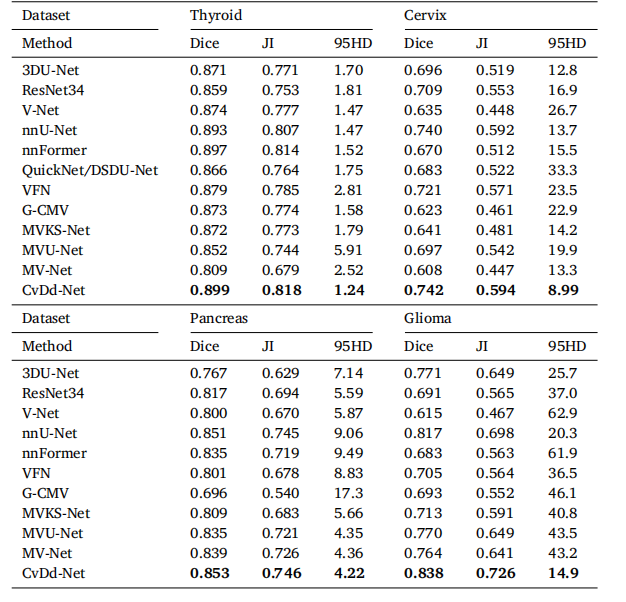
Table 2Segmentation performance of all competing methods on four datasets.
表2 四个数据集上所有竞争方法的分割性能。
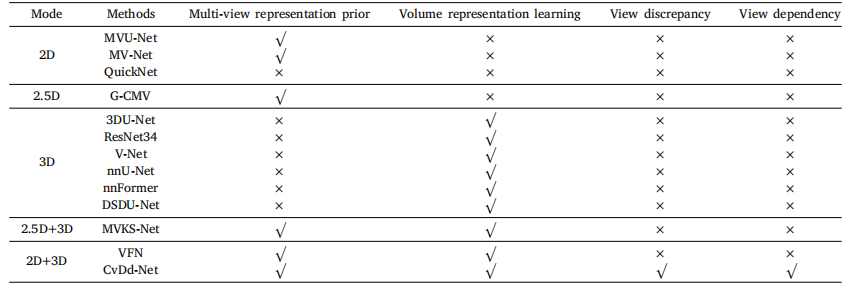
Table 3Comparison between our method and others.
表3 我们的方法与其他方法的比较。
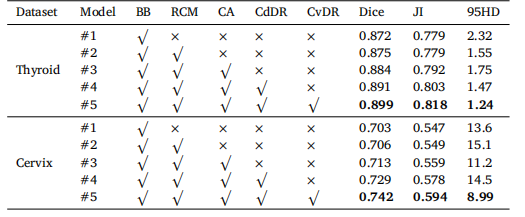
Table 4Segmentation performance of CvDd-Net with different settings, including RCM, CA,CdDR and CvDR. BB denotes backbone.
表4CvDd-Net在不同设置下的分割性能,包括RCM、CA、CdDR和CvDR。BB表示主干网络。
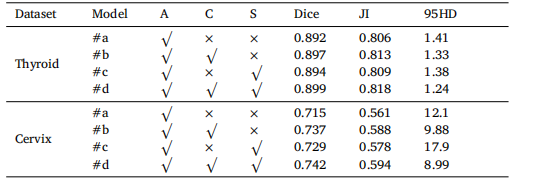
Table 5Segmentation performance of CvDd-Net with different multi-view slice representationon two datasets. ‘A’, ‘C’, and ‘S’ denote axial, coronal, and sagittal views, respectively.
表5CvDd-Net在两个数据集上使用不同多视角切片表示的分割性能。“A”、“C”和“S”分别表示轴向、冠状和矢状视图。
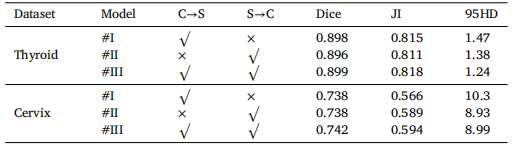
Table 6Segmentation performance of CvDd-Net with different cross-view dependency relationon two datasets. ‘C→S’ and ‘S→C’ represent the two cross-view relations to computeview dependency weights.
表6CvDd-Net在两个数据集上使用不同交叉视角依赖关系的分割性能。“C→S”和“S→C”表示计算视角依赖权重的两种交叉视角关系。
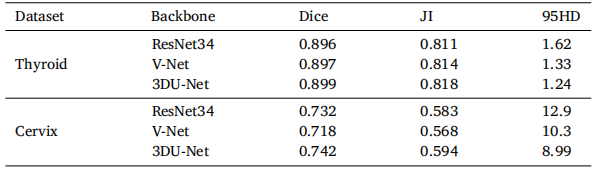
Table 7Segmentation performance of CvDd-Net with different backbones on two datasets.
表7CvDd-Net在两个数据集上使用不同主干网络的分割性能。
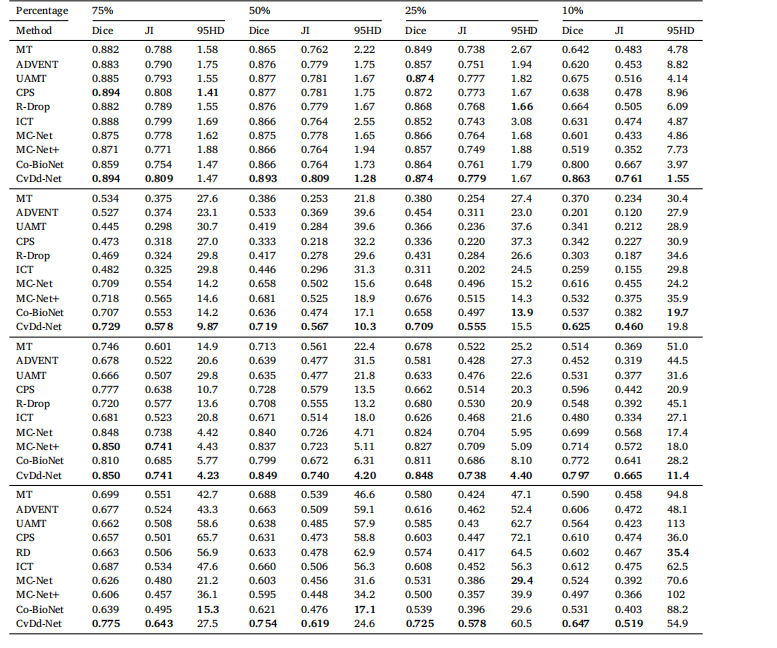
Table 8Segmentation performance of all semi-supervised methods on four datasets.Percentage 75% 50% 2
表8在四个数据集上所有半监督方法的分割性能。百分比:75%、50%。
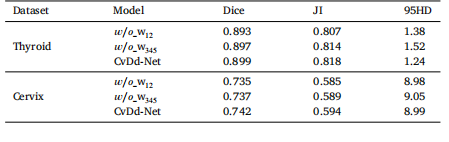
Table 9Segmentation performance of CvDd-Net with different adaptive weights (w1 and w2 inCdDR, and w3 , w4 , and w5 in CvDR) on two datasets.
表9CvDd-Net在两个数据集上使用不同自适应权重(CdDR中的w1和w2,以及CvDR中的w3、w4和w5)时的分割性能。
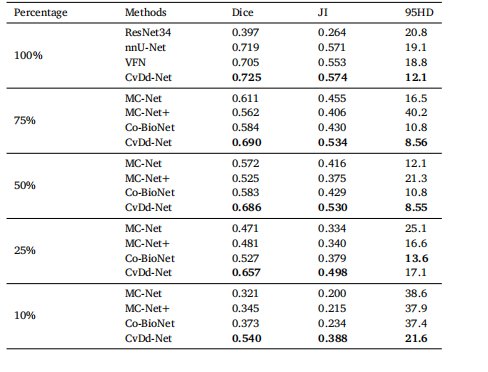
Table 10Segmentation performance of representative fully-supervised and semi-supervisedmethods on external Cervix dataset.
表10在外部宫颈数据集上,代表性全监督和半监督方法的分割性能。