(二)mac中Grafana监控Linux上的MySQL(Mysqld_exporter)
框架:Grafana+Prometheus+Mysqld_exporter
一、监控查看端安装
Grafana安装-CSDN博客
普罗米修斯Prometheus监控安装(mac)-CSDN博客
1.启动Grafana服务
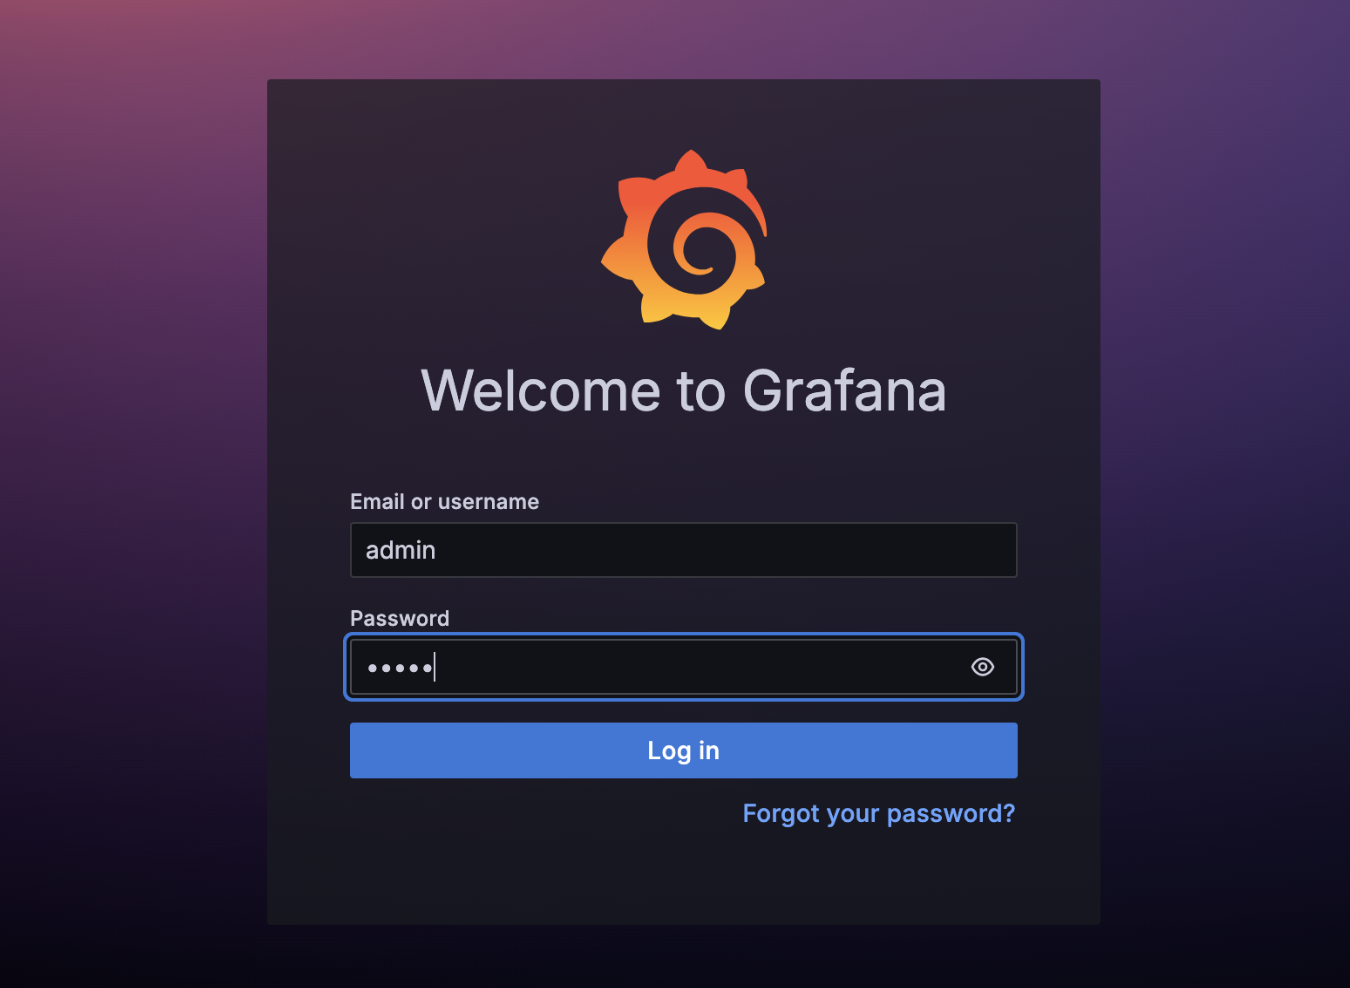
brew services start grafana- 打开浏览器输入
http://localhost:3000进入grafana登录页面
(默认用户名和密码都为admin,进入后可以更新密码,也可以跳过)
2.启动 prometheus服务
查看安装位置
which prometheus找到默认配置prometheus.yml的位置
/usr/local/etc/prometheus.yml启动Prometheus server
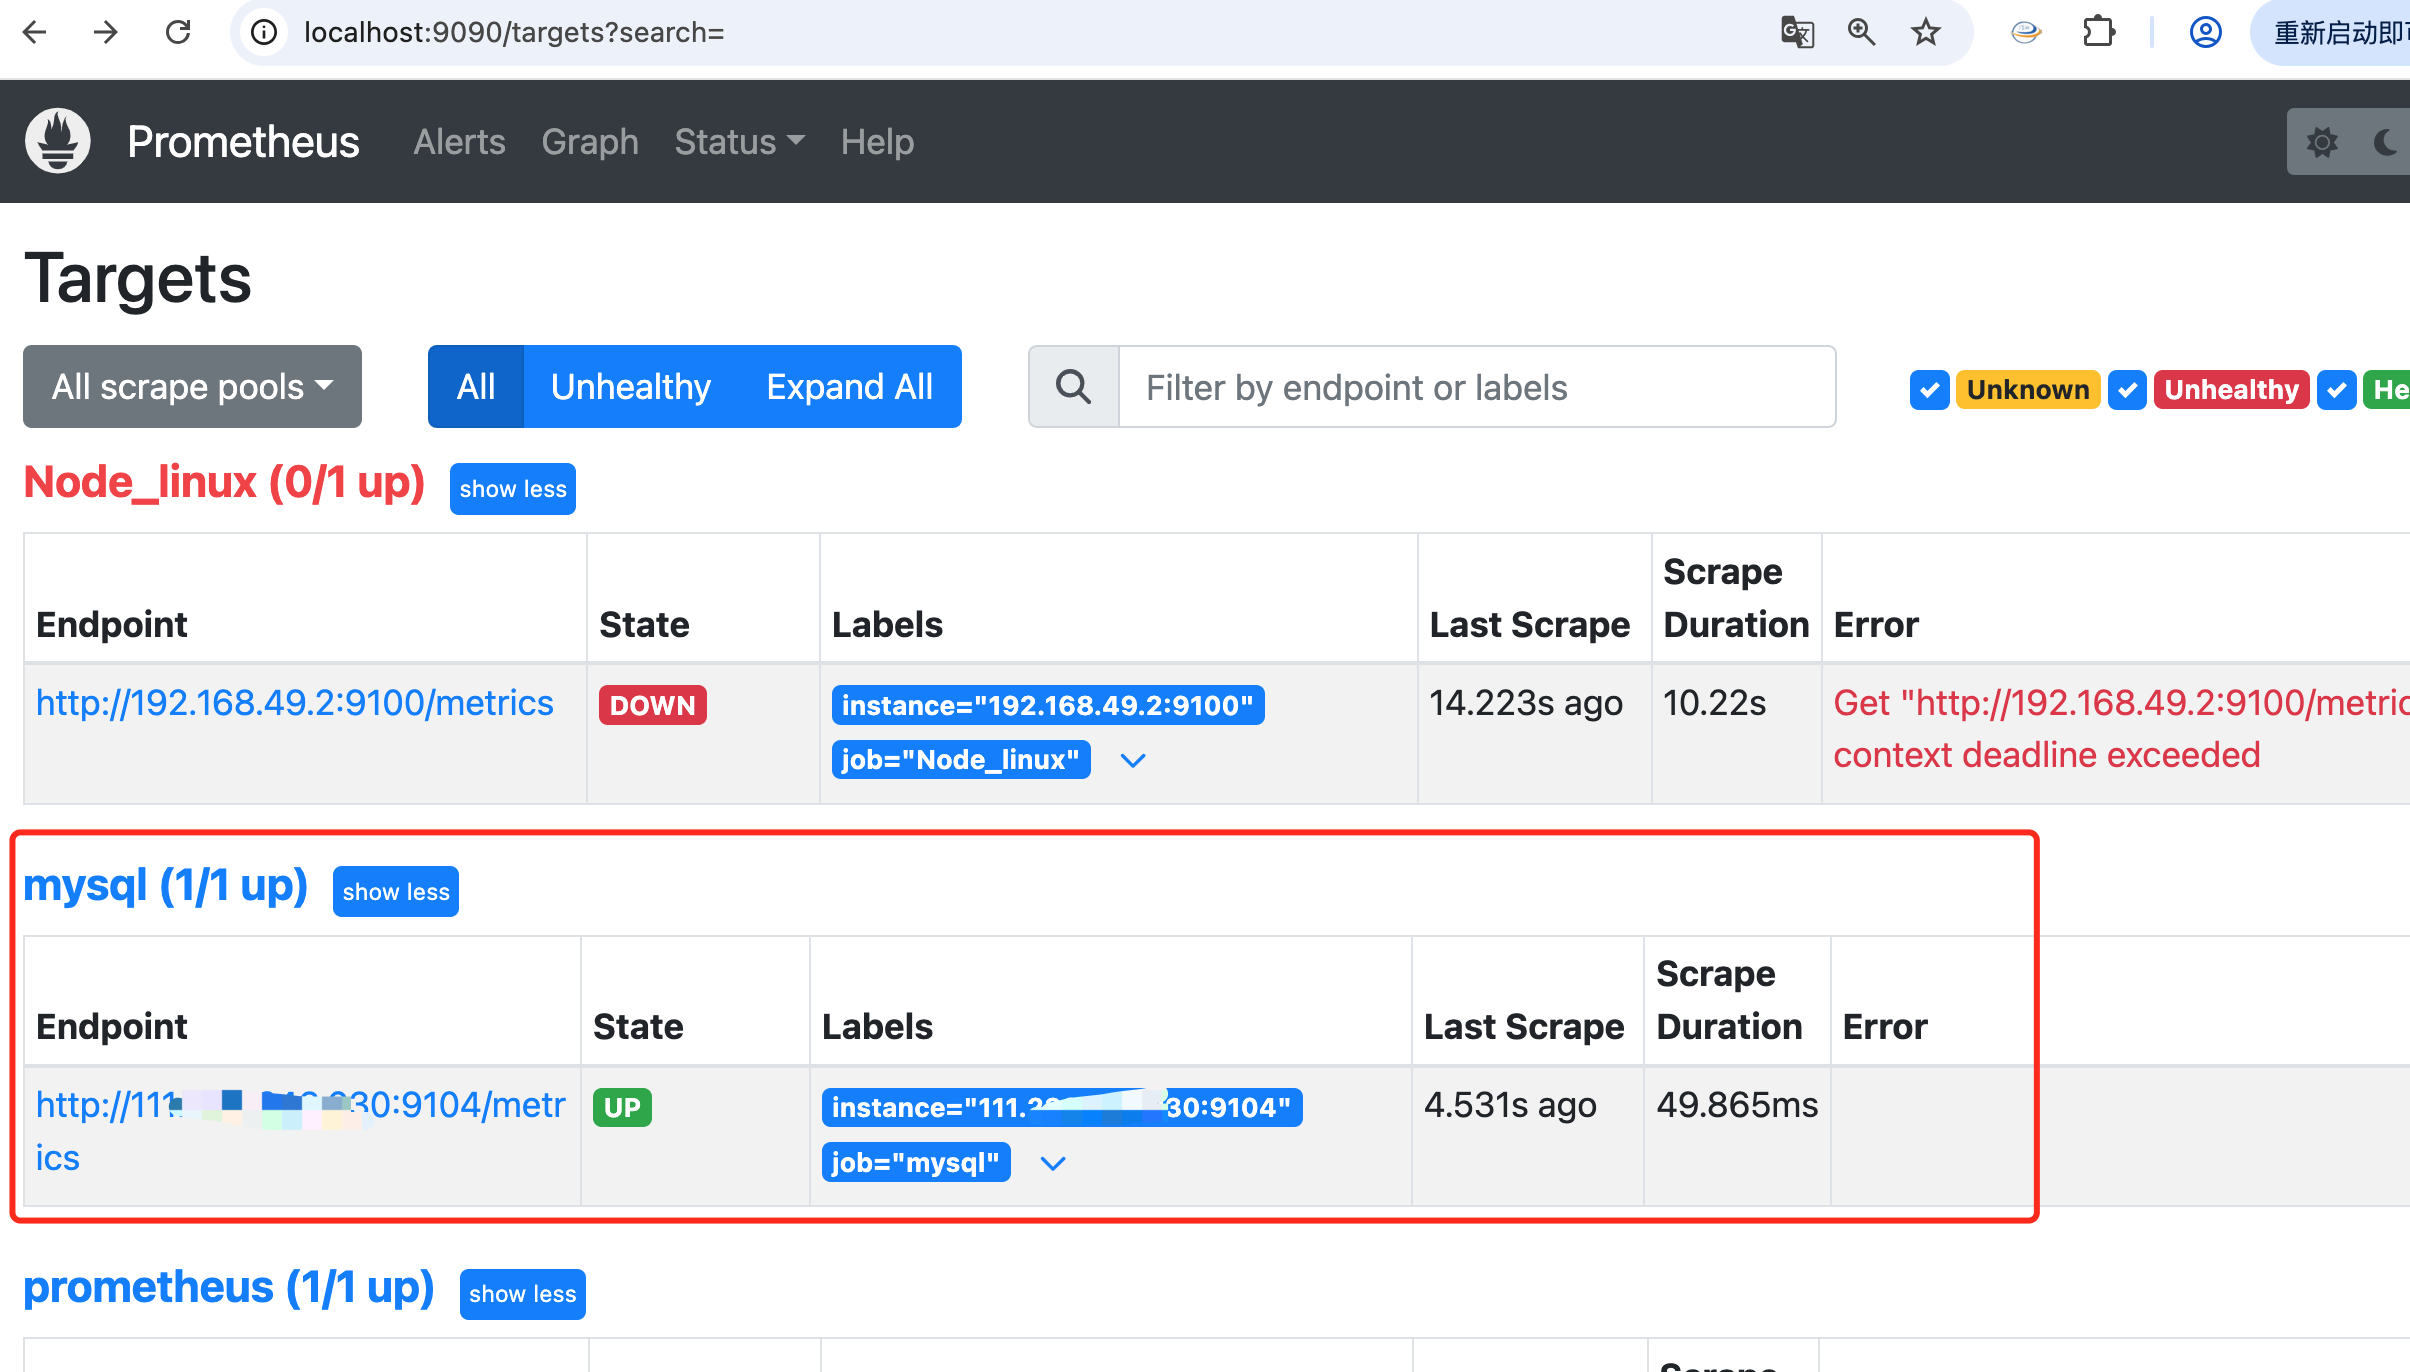
prometheus --config.file=/usr/local/etc/prometheus.yml启动后浏览器输入: http://localhost:9090/targets
http://localhost:9090/targets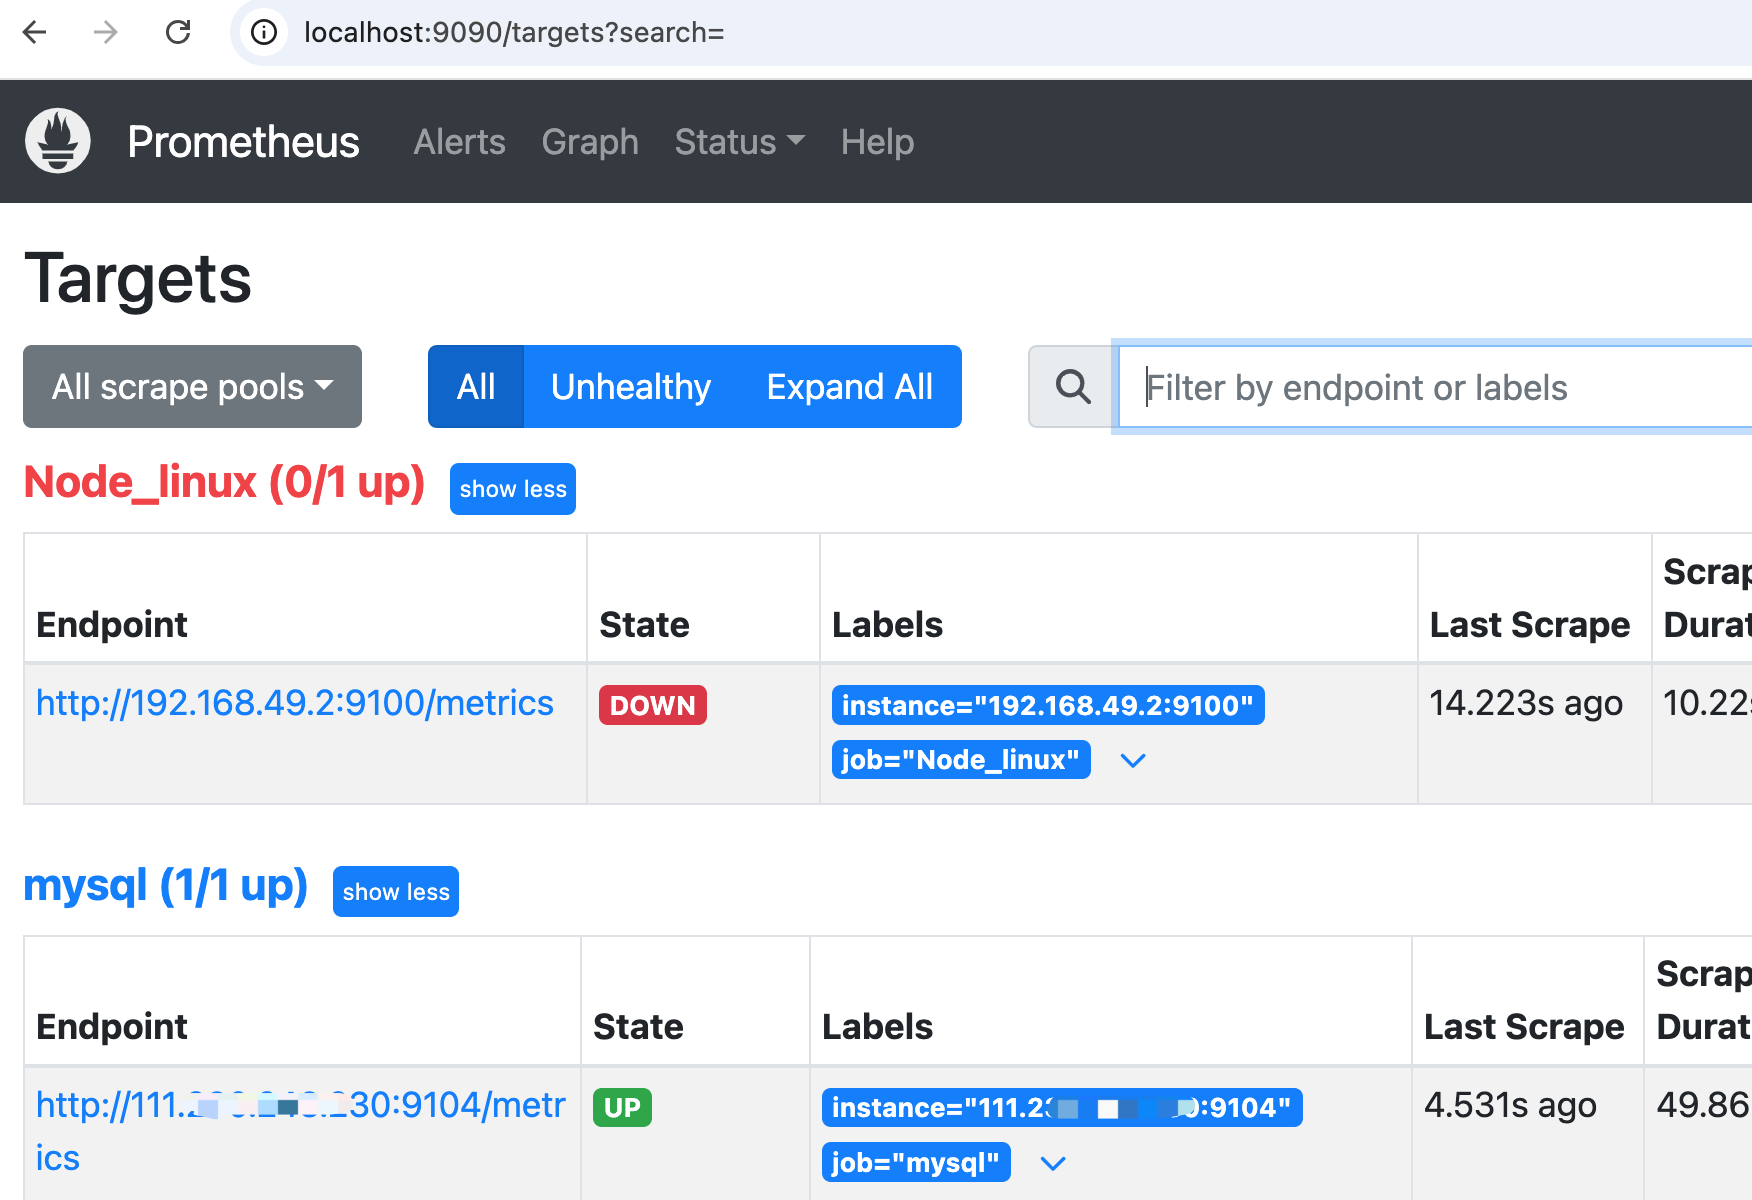
查看监控数据
http://localhost:9090/metrich二、被监控端安装
Linux安装mysql_exporter-CSDN博客
设置后,可在http://localhost:9090/targets页面中看到
三、应用
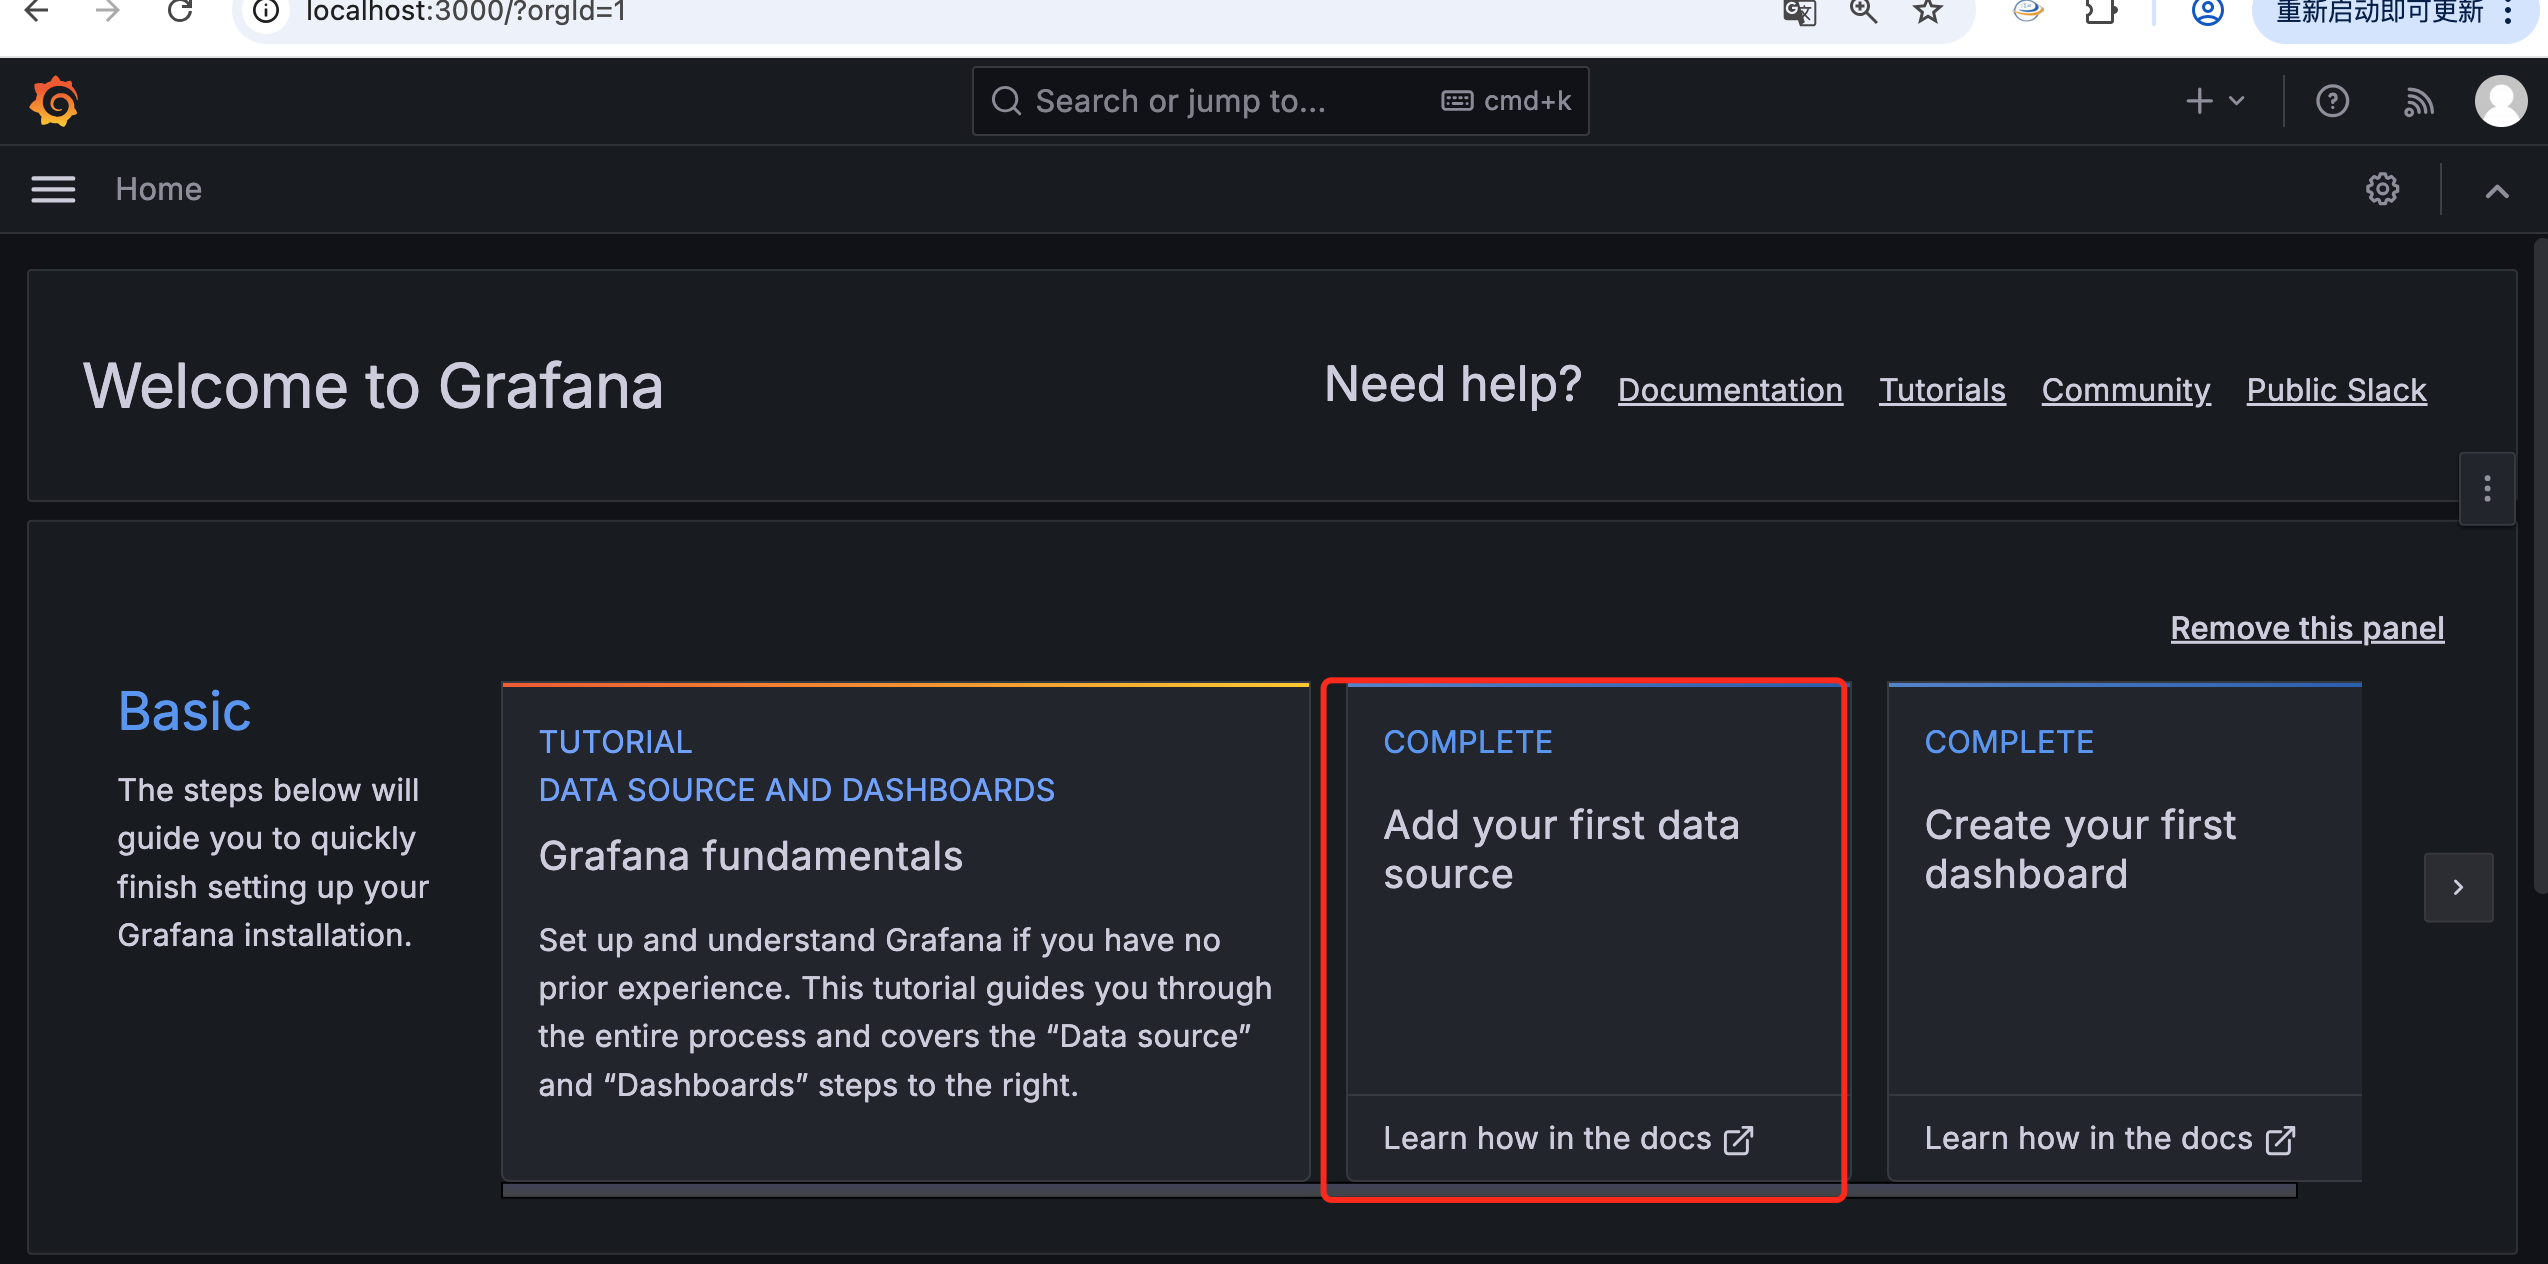
1.grafana登录后,添加数据源
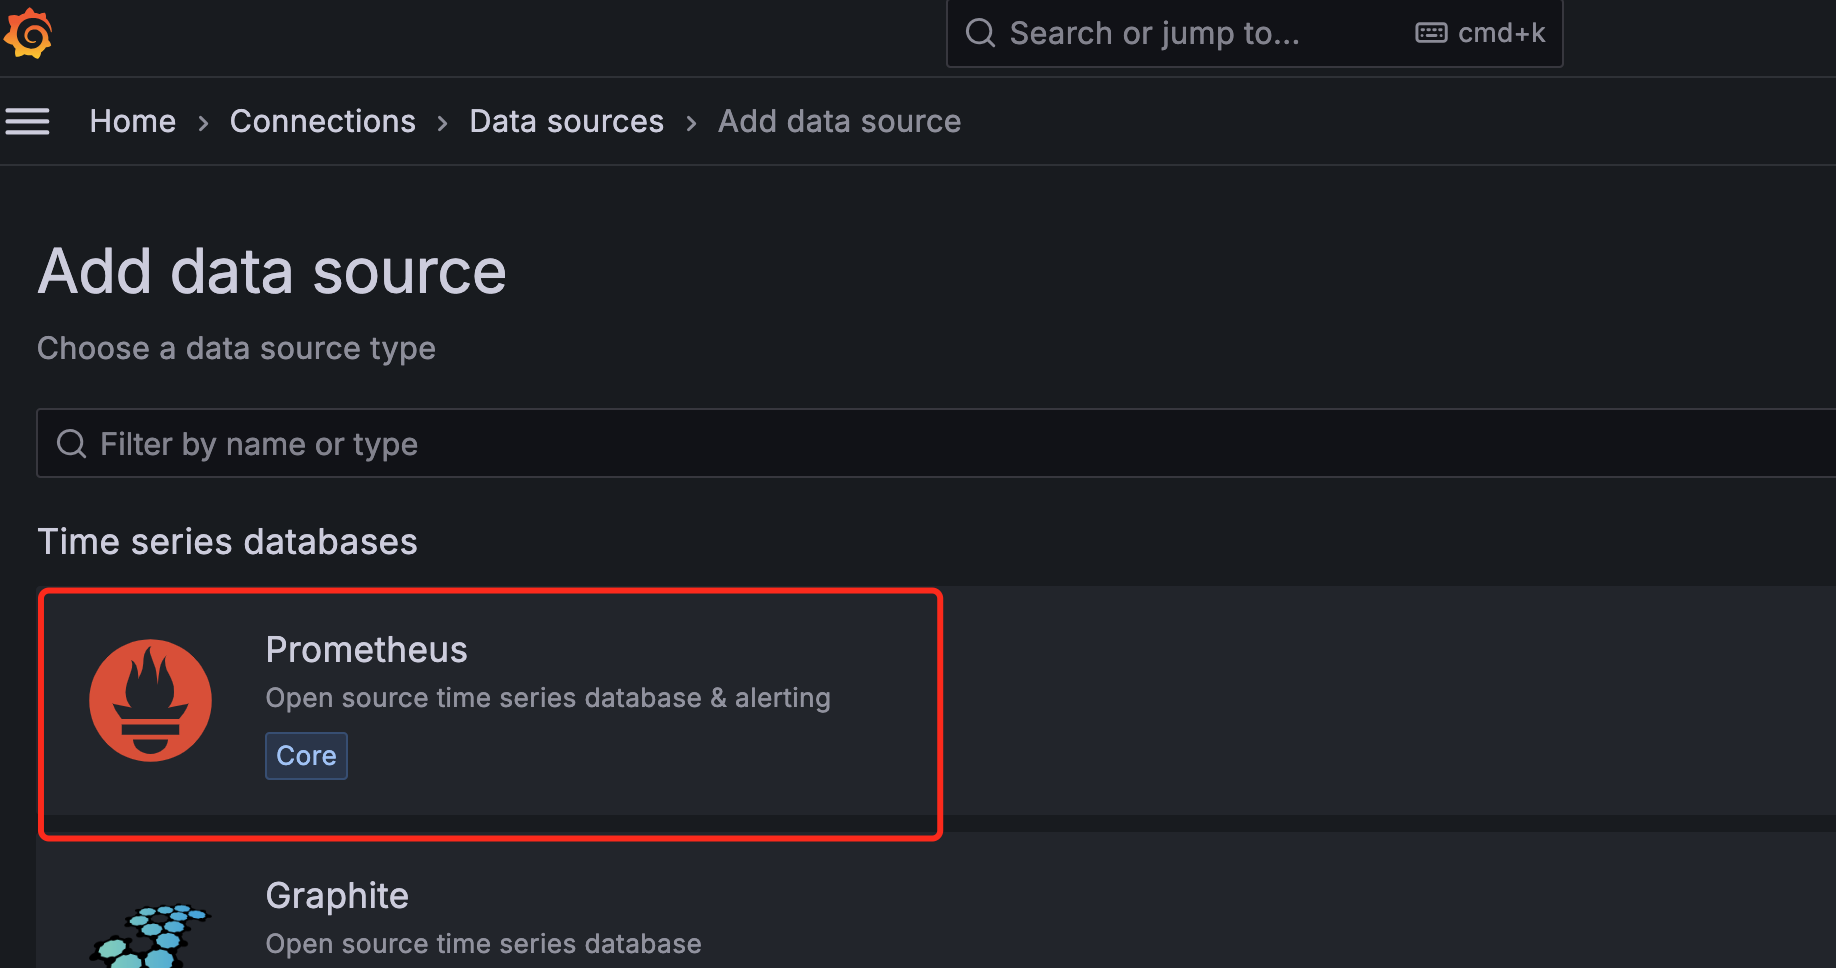
2.选择 prometheus
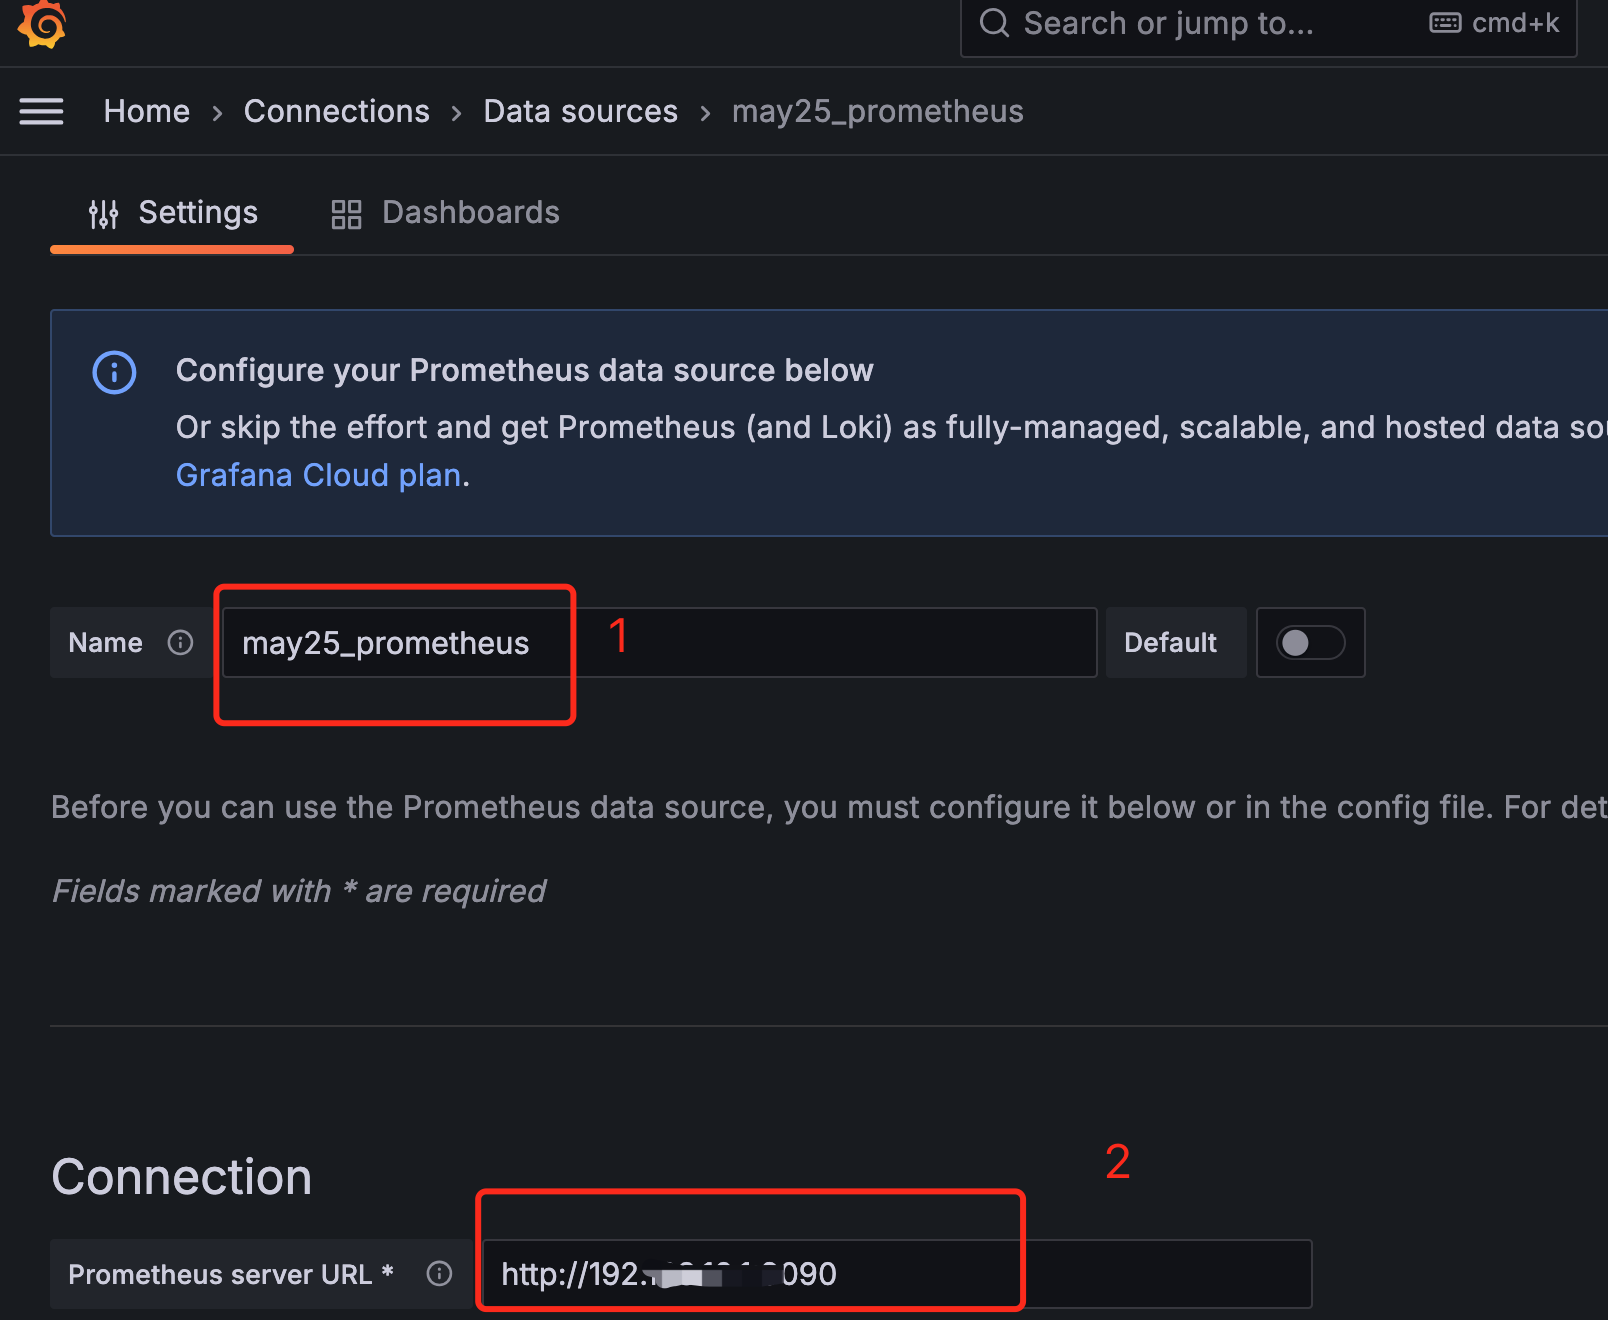
下面第 2 步是prometheus的服务URL,本文是本机的ip地址
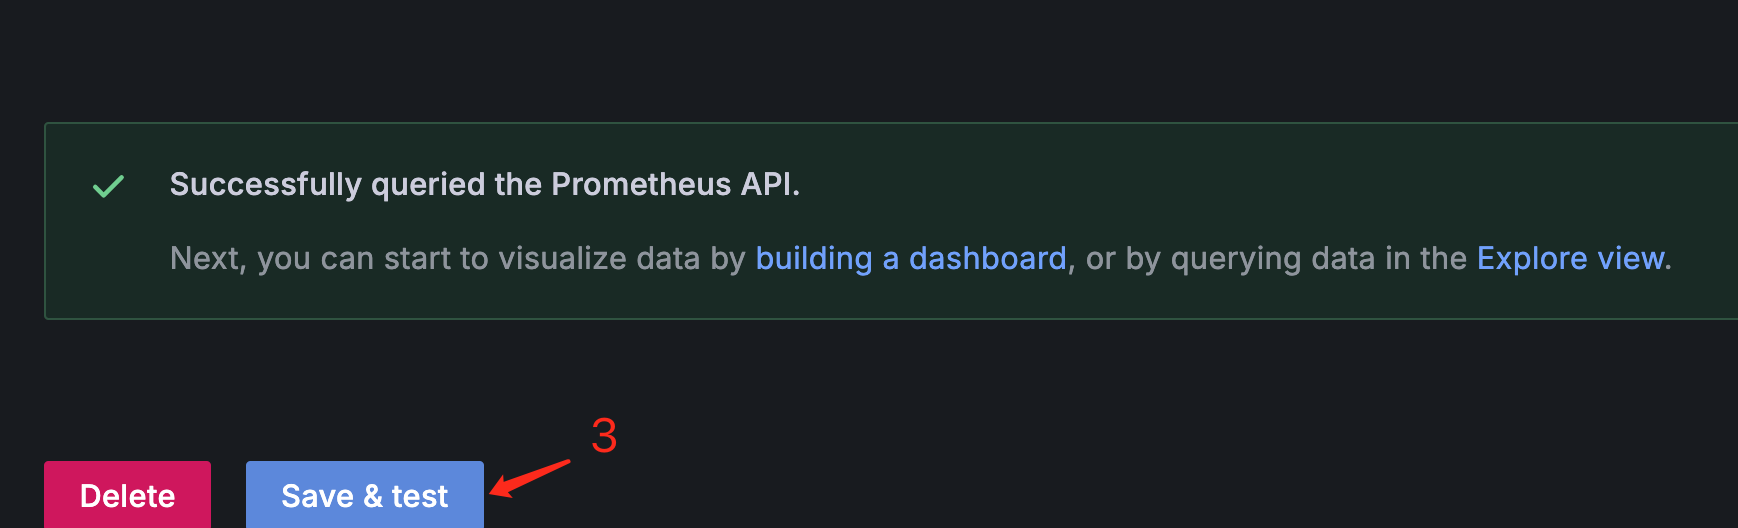
拉到页面最下面,点击“save and test”
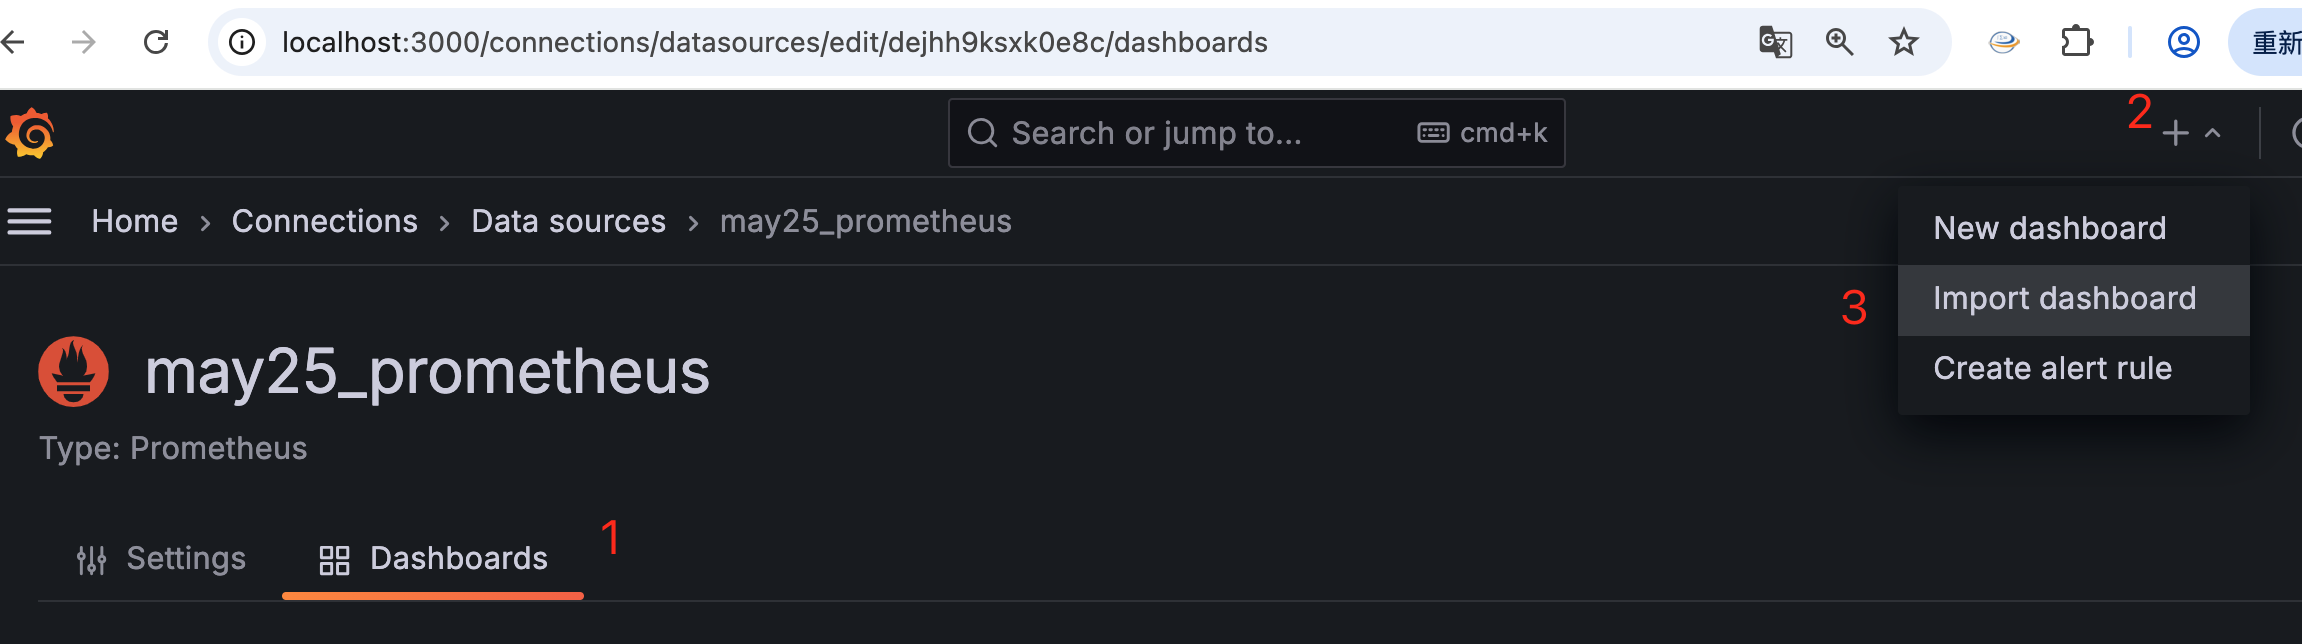
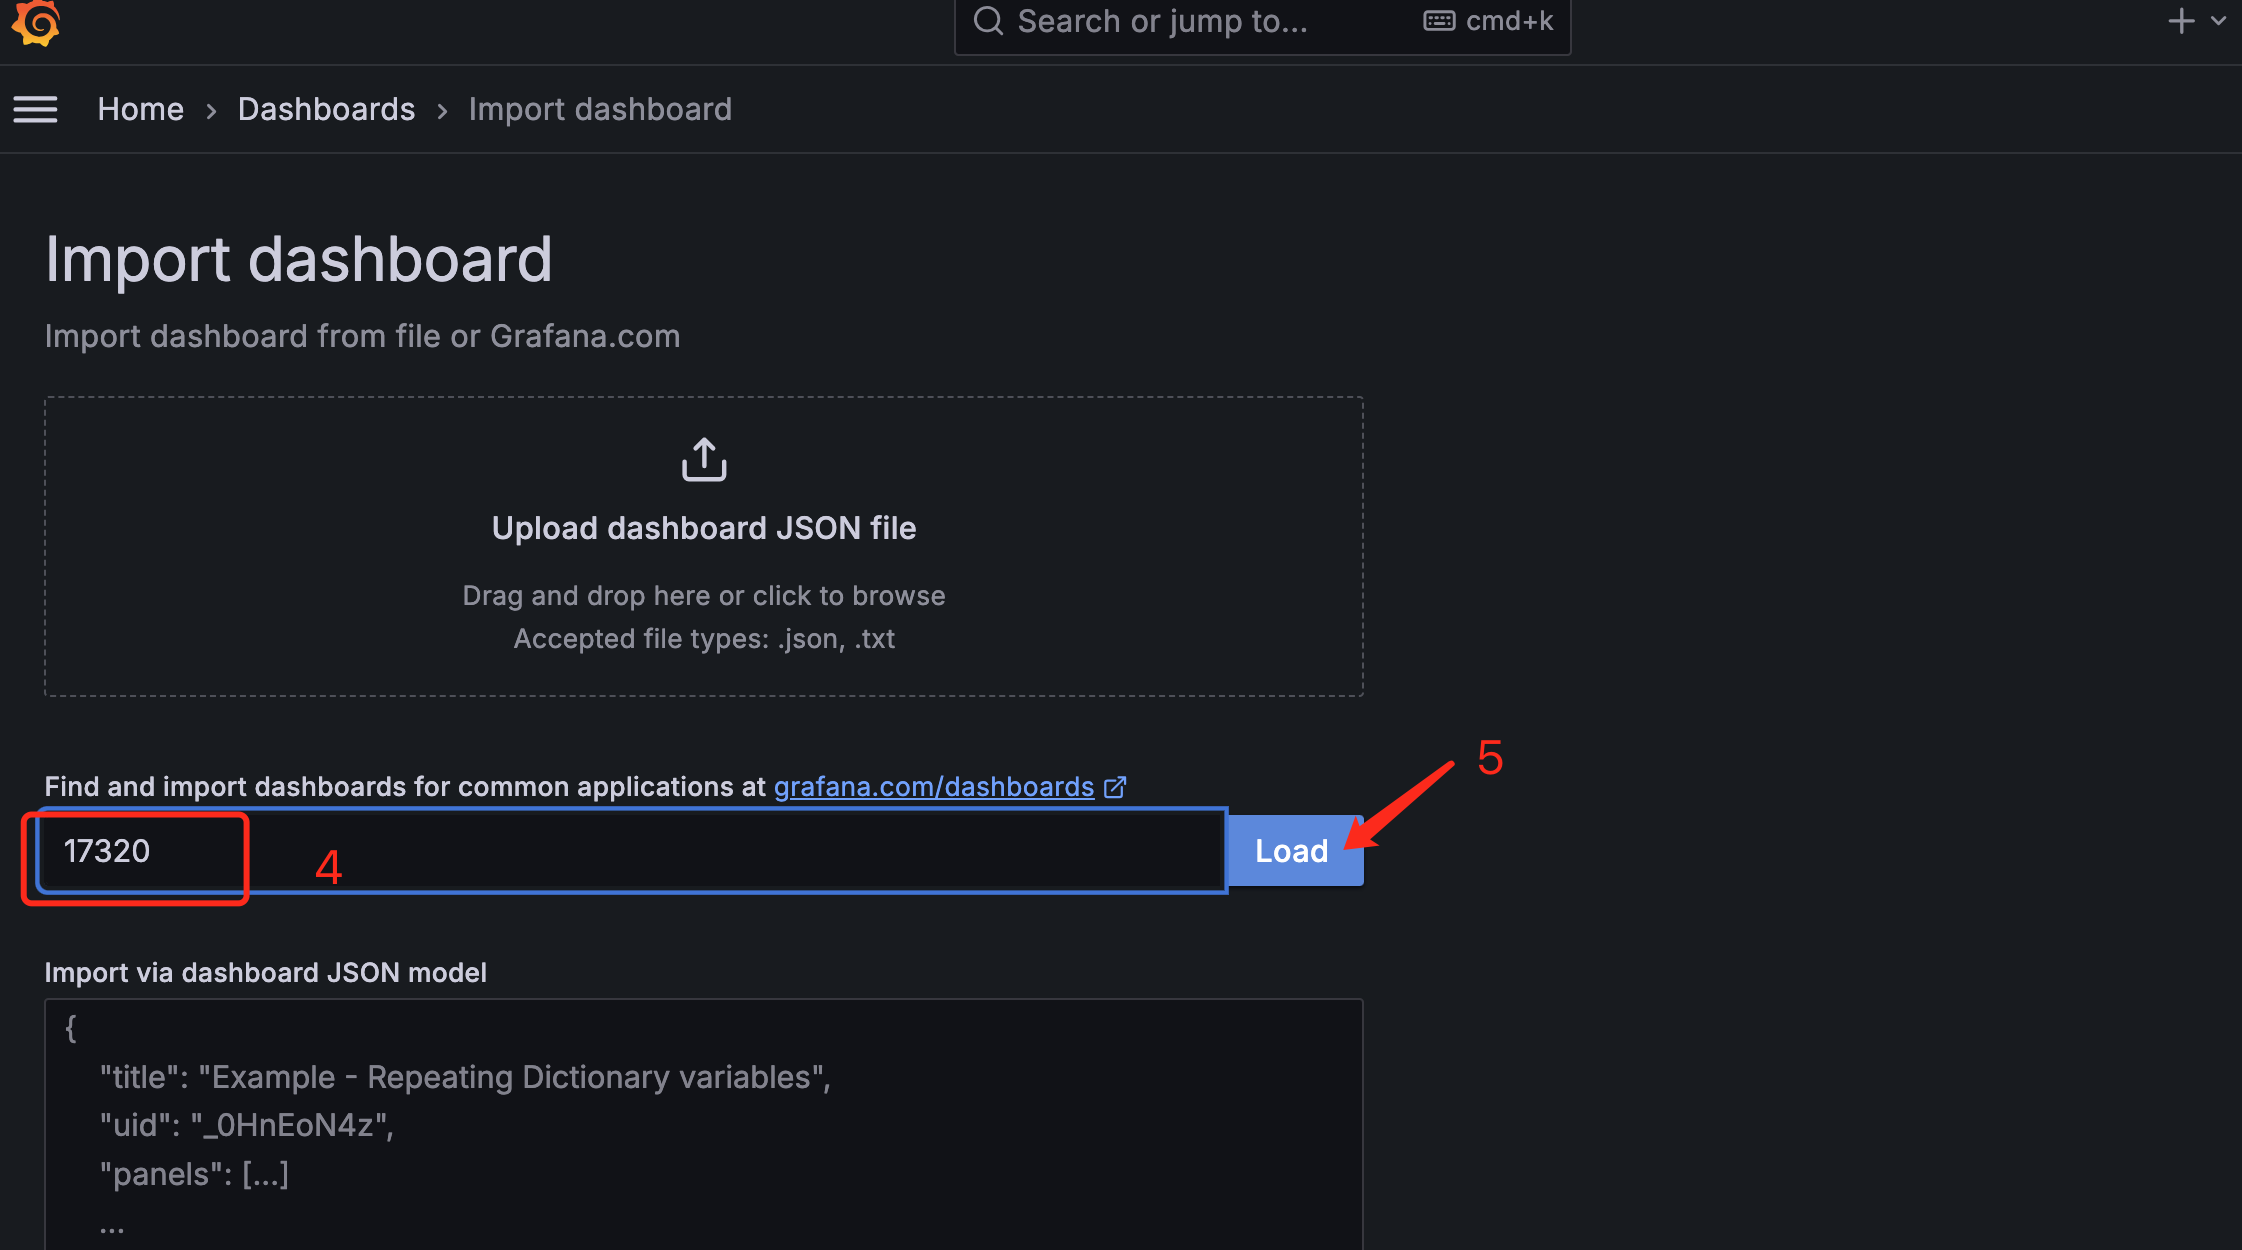
3.添加模板
仪表盘 import, ID:17320 或者 14057
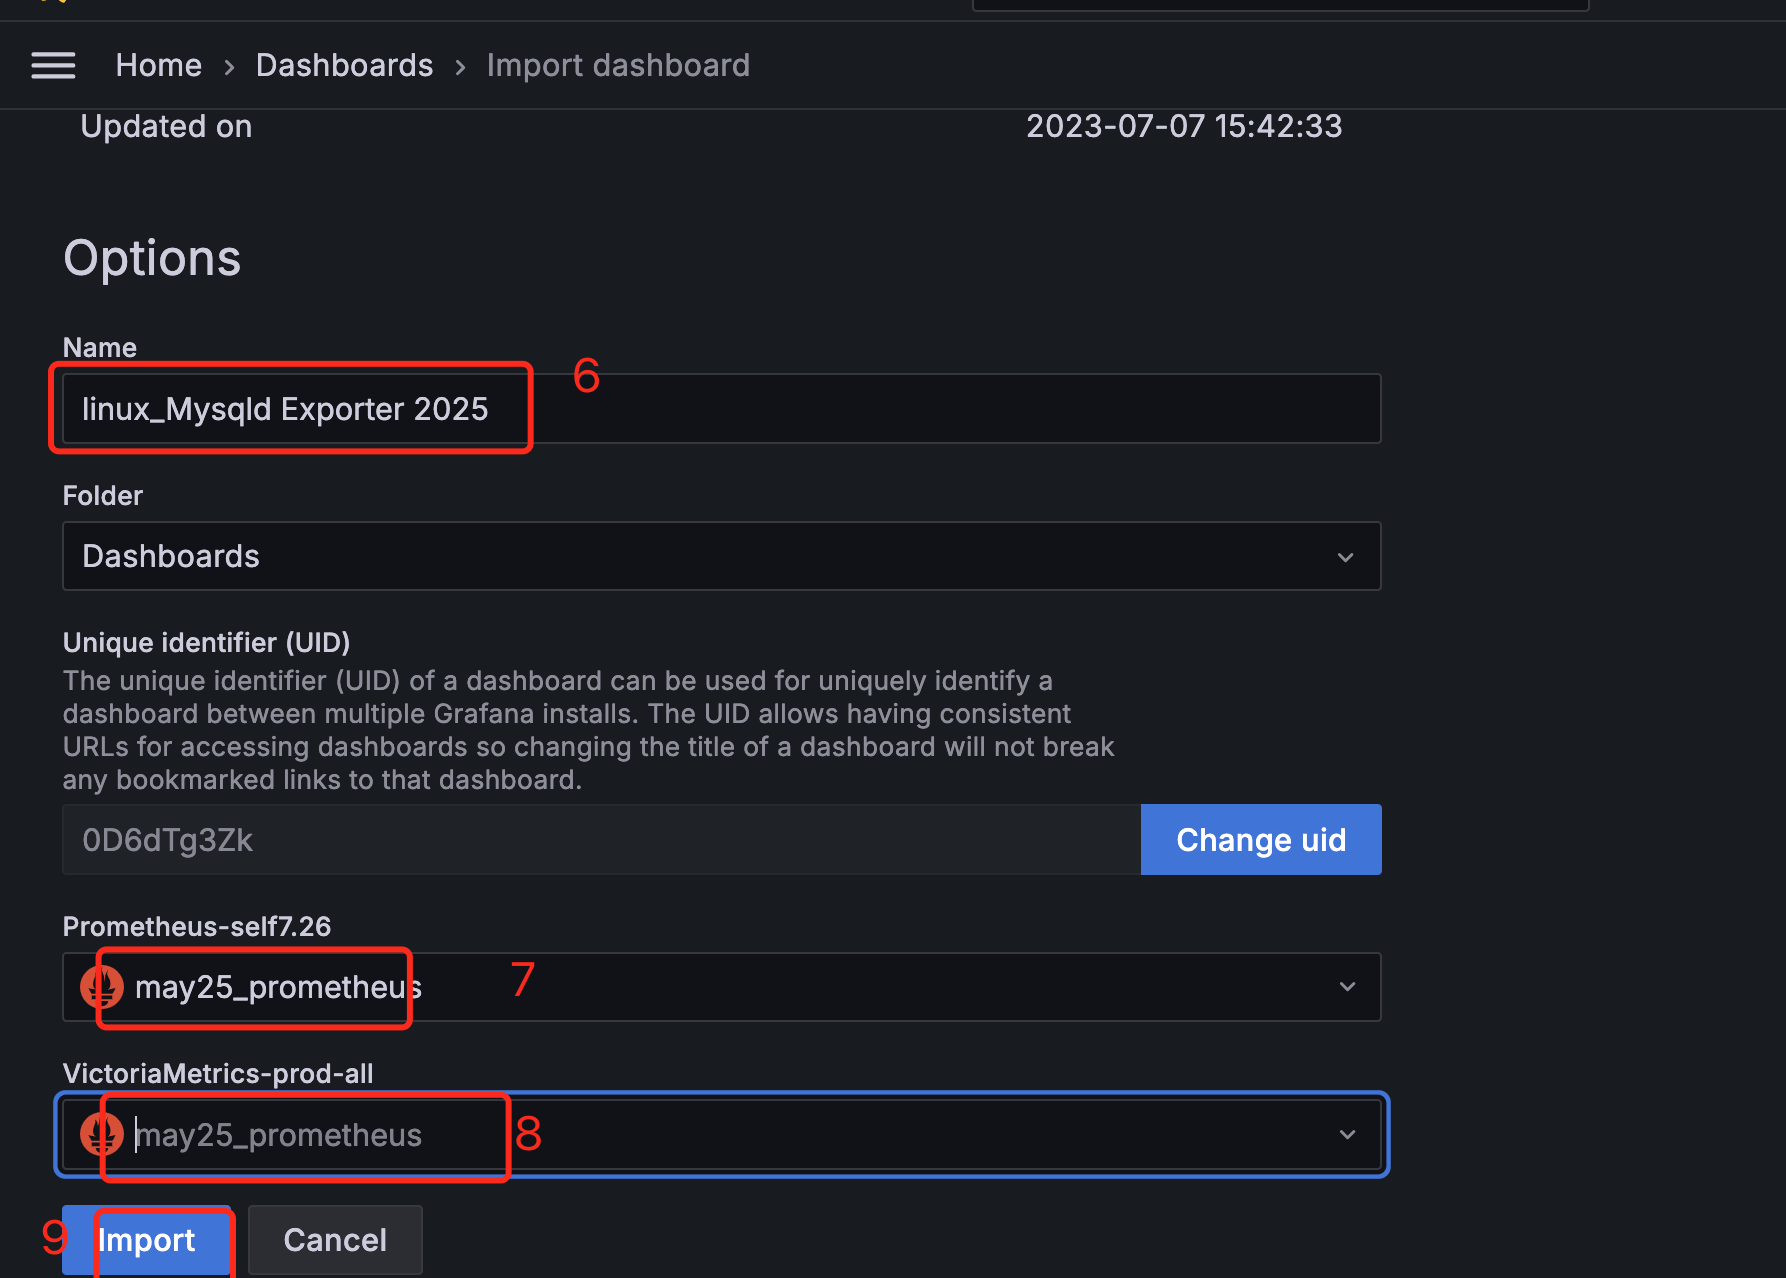
Mysqld_exporter模板
选择自己需要的模板
上滑到页面顶端
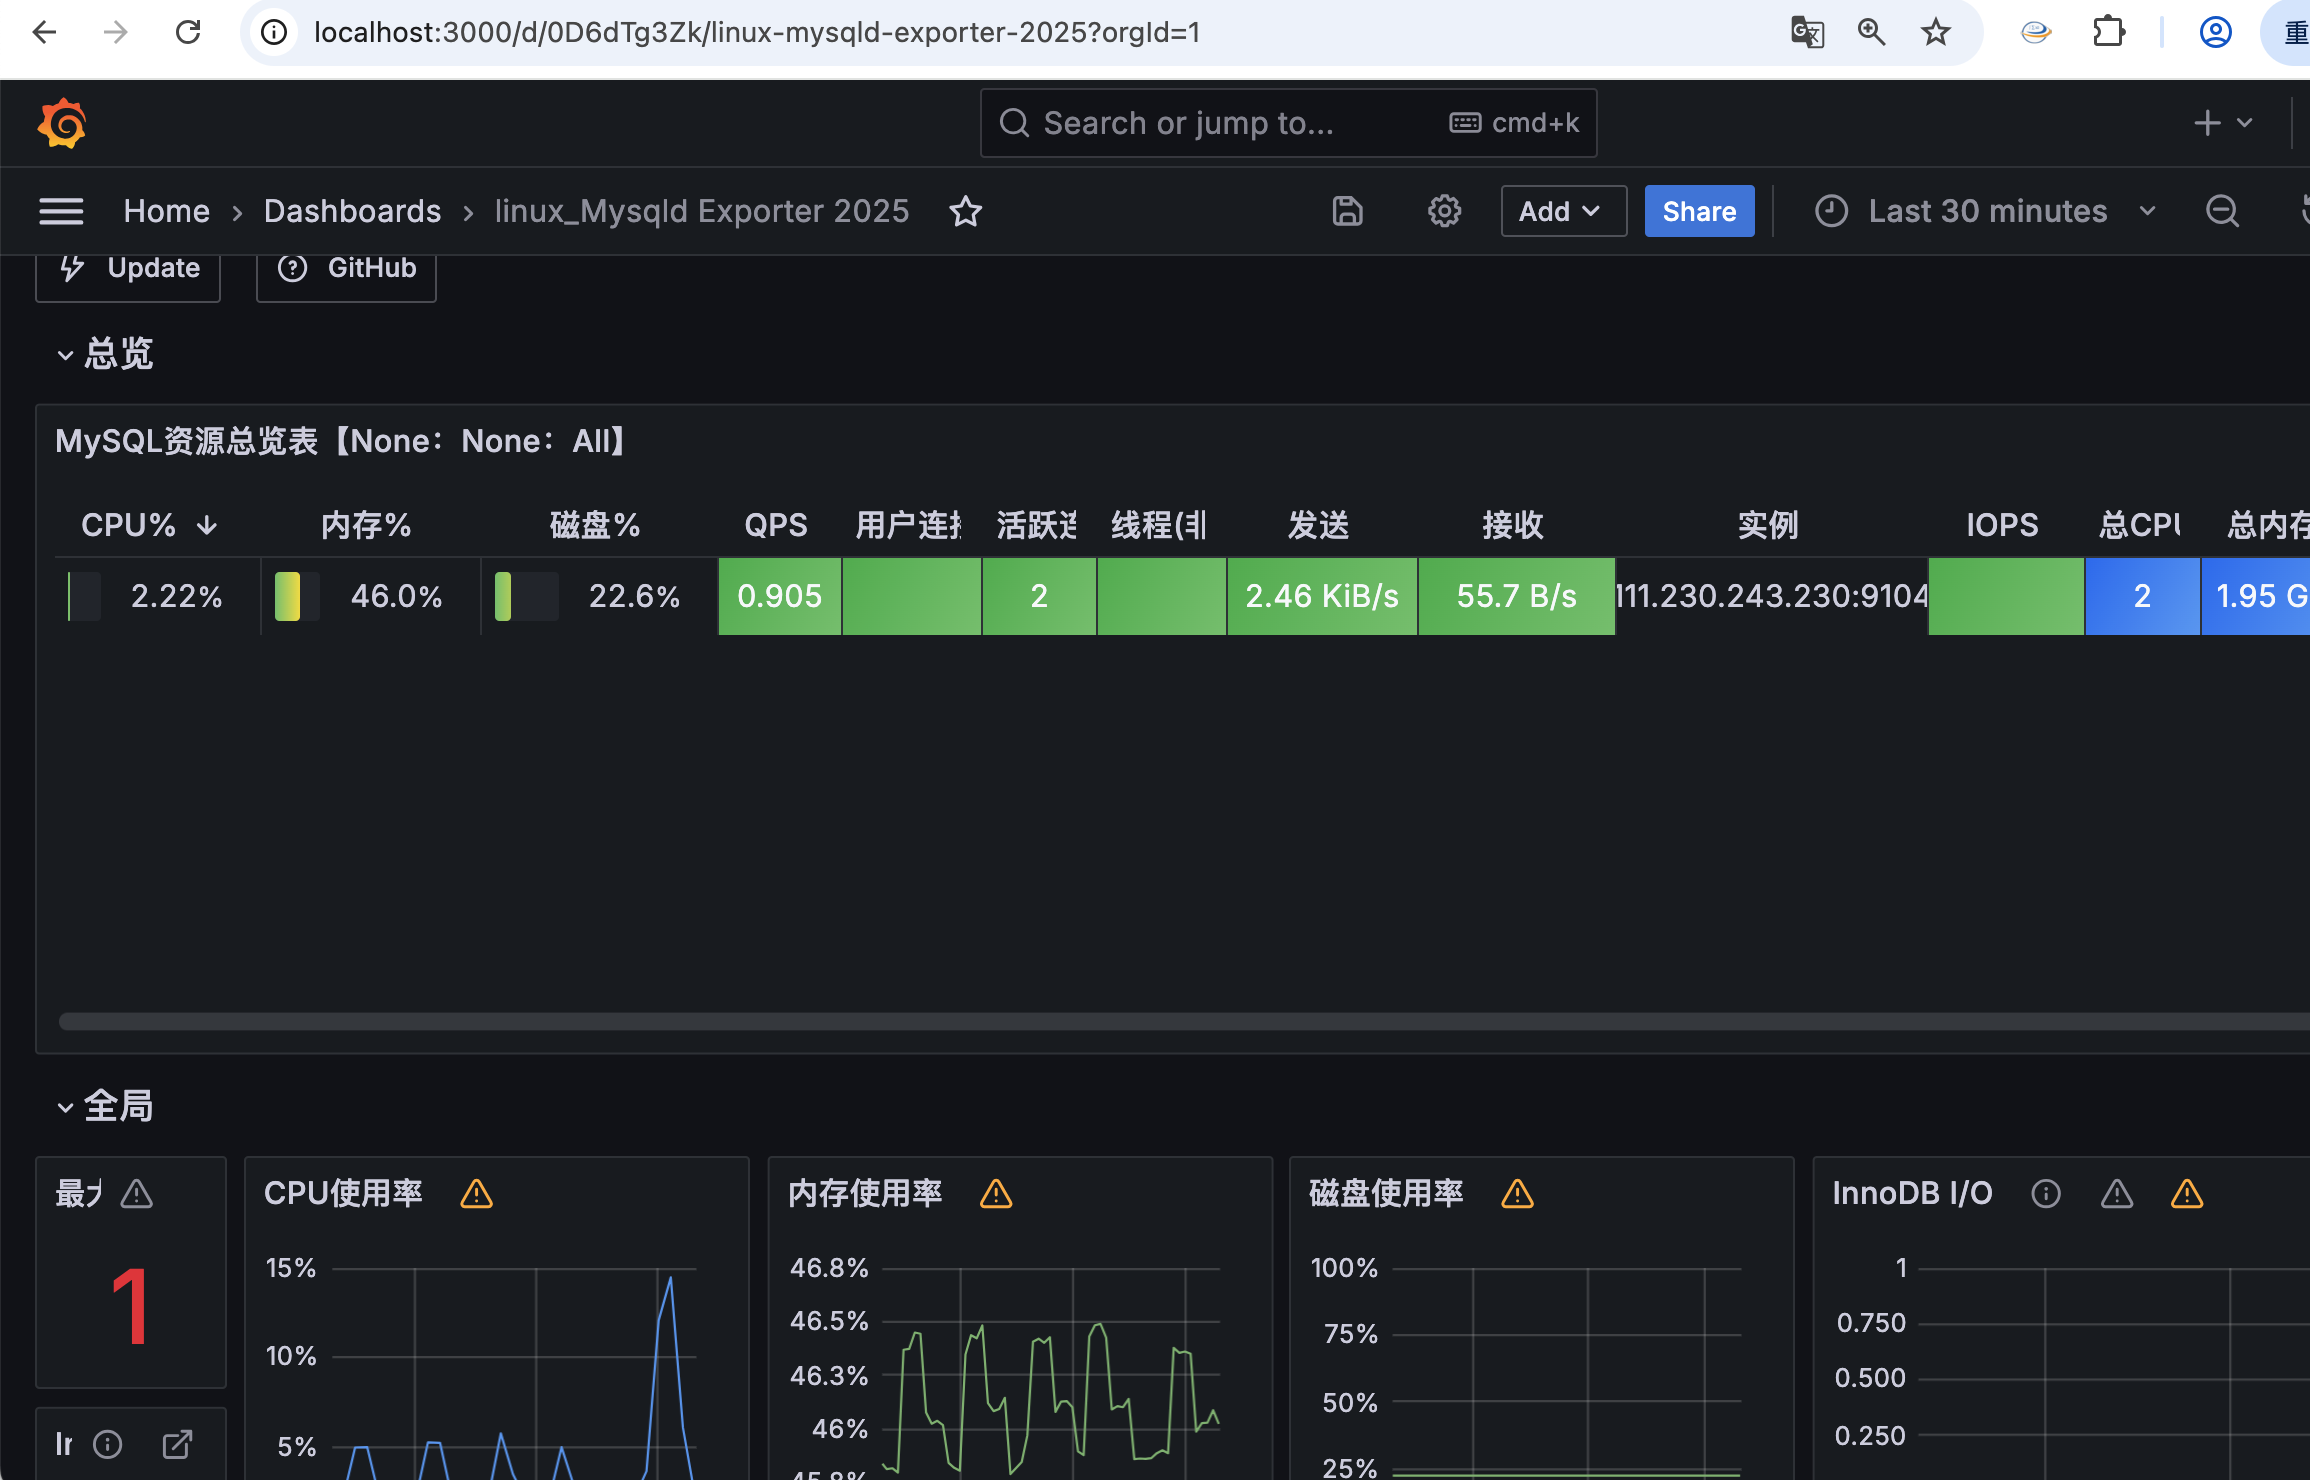
4.效果
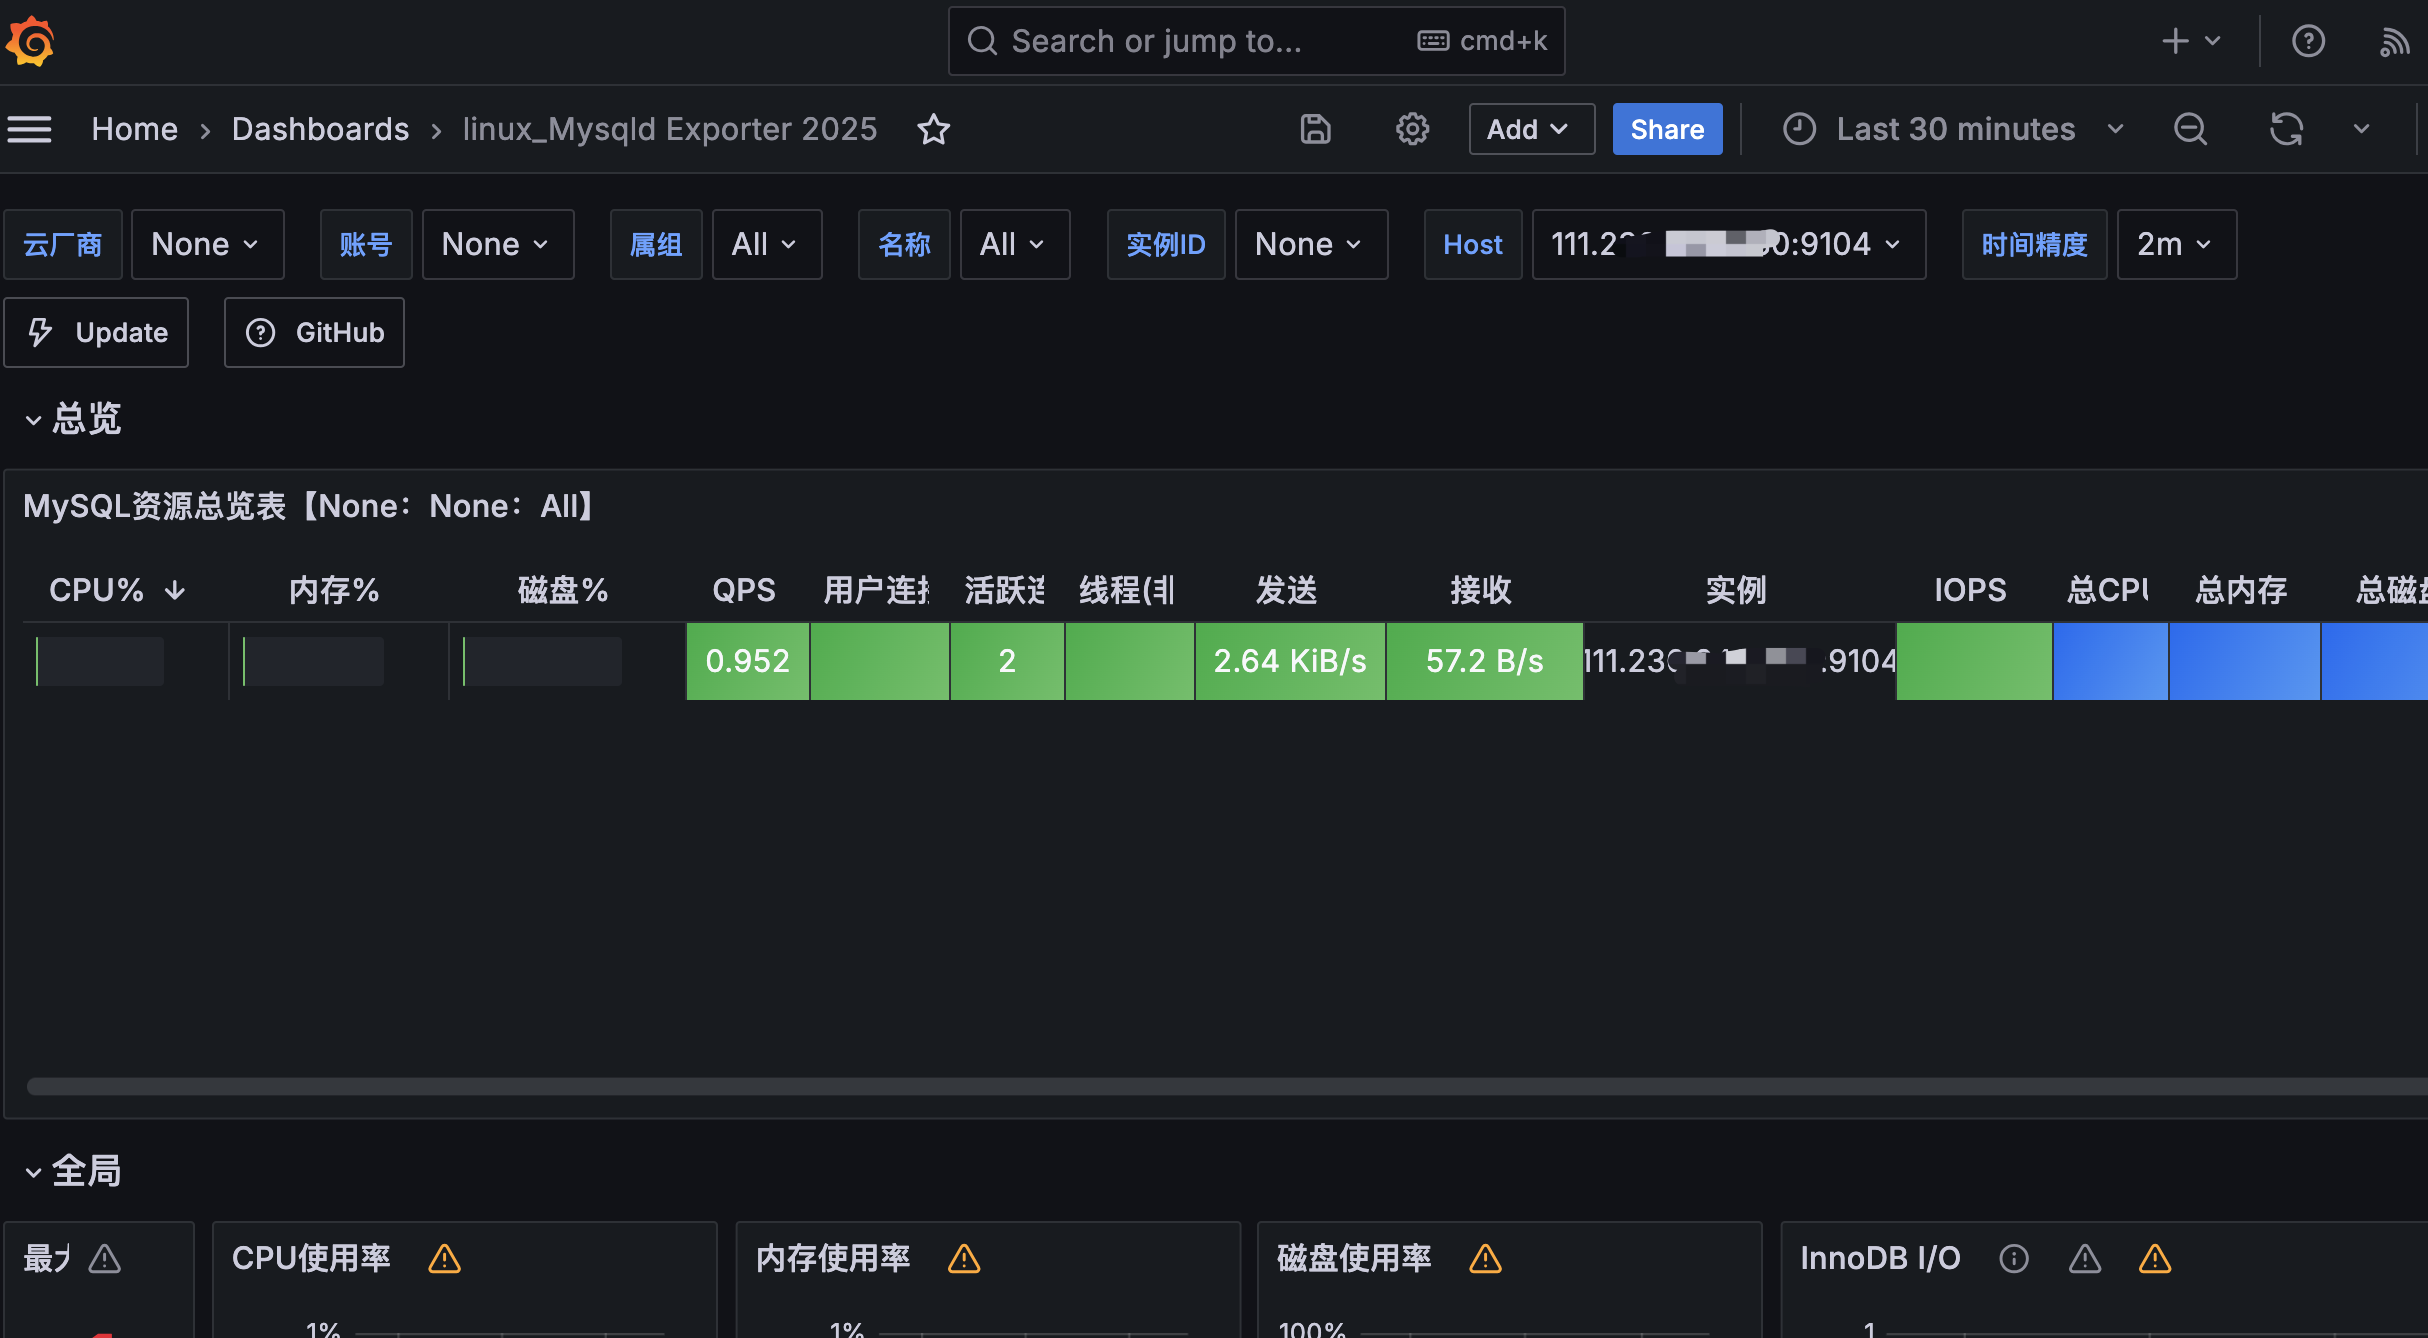
安装Node_exporter后,CPU\内存等才会显示